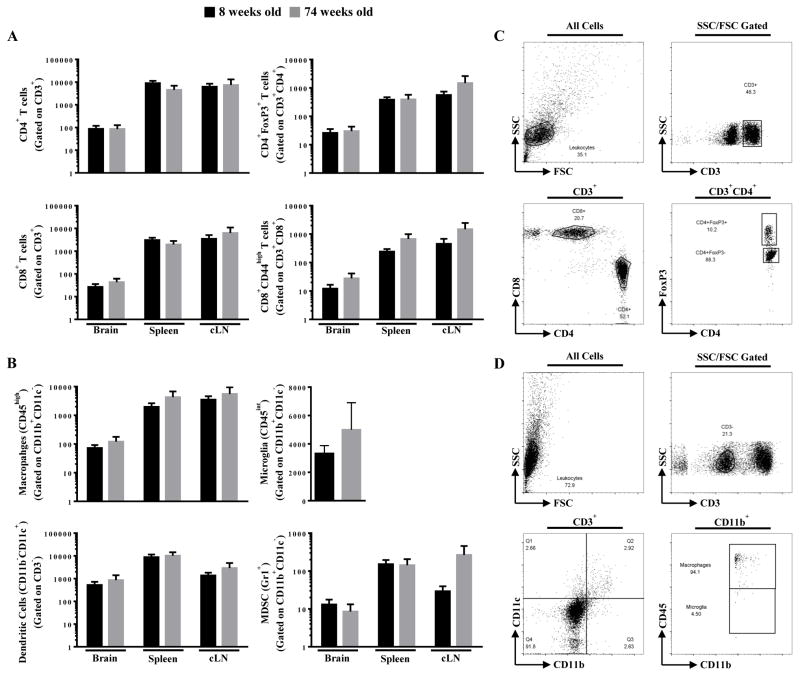
Figure 4. T cell and antigen presenting cell (APC) levels in young and old mice with brain tumors.
Eight week old (n=8) and 74 week old (n=5) mice were intracranially-engrafted 2 × 10⁵ GL261 cells. The absolute numbers of (A) CD4+ T cells, CD4+FoxP3+ T cells, CD8+ T cells, CD8+CD44high T cells, (B) macrophages, microglia, dendritic cells, and myeloid derived suppressor cells (MDSC) isolated from brain tumor, spleen, and cervical lymph node (cLN) of tumor-bearing mice at 3 weeks post-engraftment. The flow cytometry gating strategy is demonstrated for (C) T cell and (D) APC subpopulations is demonstrated. Bar graphs in A and B are shown as mean ± SEM.

