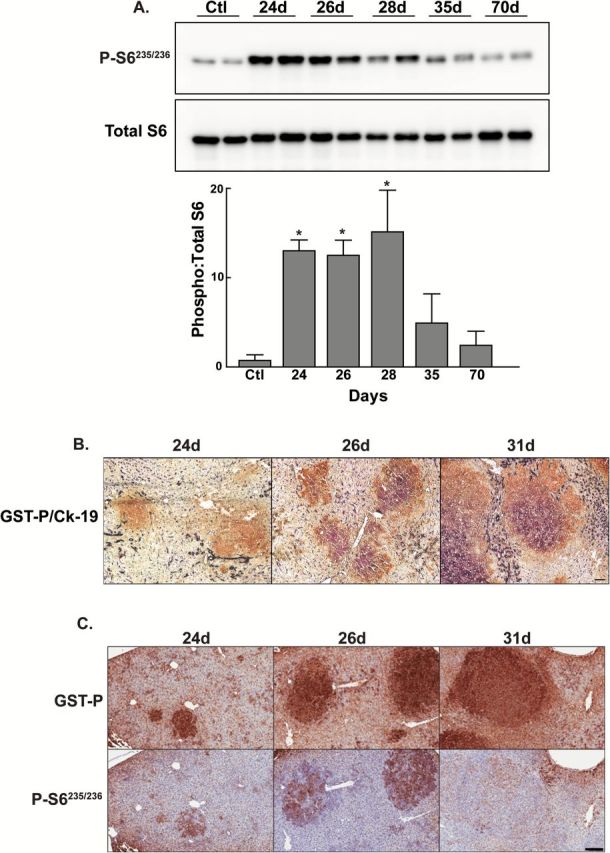
Figure 2.

mTORC1 signaling during the initiation and early progression of focal lesions. (A) Representative Western blots for phosphoribosomal protein S6Ser235/236 and total S6 performed on total liver homogenates derived from control (Ctl) or rats placed on the Solt-Farber protocol and euthanized at various days post-DENA administration. The graph shows densitometric data as the mean + 1 SD for the ratio of phospho-S6 to total S6. n = 3 per group. *P < 0.05 versus the control group. (B) Dual immunohistochemistry for GST-P (brown) and CK19 (purple). Cryosections were counterstained with methyl green and representative 10× images acquired. Scale bar: 100 µm. (C) Immunohistochemical staining for GST-P and phospho-S6Ser235/236 was performed on consecutive sections from Solt-Farber animals. Sections were counterstained with hematoxylin. Shown are representative Aperio Scans acquired at 10×. Scale bar: 150 µm.
