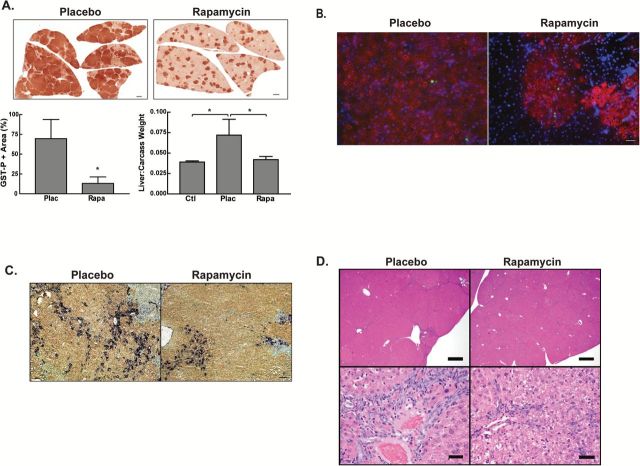
Figure 3.
The effect of short-term rapamycin administration during the early period of mTOR activation on the subsequent development of focal lesions. Rats were implanted with 21-day slow release rapamycin or placebo pellets on day 21 of the Solt-Farber protocol and euthanized 70 days post-DENA administration. (A) Immunohistochemistry for GST-P. Shown are representative images of Aperio scans acquired at 0.7×. Scale bar: 2.5mm. The left graph illustrates the quantification of lesion burden represented as mean + 1 SD. n ≥ 6 per group. *P < 0.05. The right graph shows the ratio of liver to carcass weight for age-matched control rats (Ctl), and placebo (Plac) or rapamycin-treated (Rapa) Solt-Farber rats. n ≥ 3 per group. *P < 0.05. (B) Cryosections were stained with an antibody against GST-P (red) and a marker of DNA synthesis EdU (green). Slides were counterstained with DAPI (blue) and images acquired at 20×. Scale bar: 100 µm. (C) Cryosections were stained with an antibody against GST-P (brown) and CK19 (purple). Slides were counterstained with methyl green and images acquired at 20×. Scale bar: 100 µm. (D) H&E staining acquired at 2× (top panel) and 40× (bottom panel). Top panel, Scale bar: 600 µm. Bottom panel, Scale bar: 25 µm.

