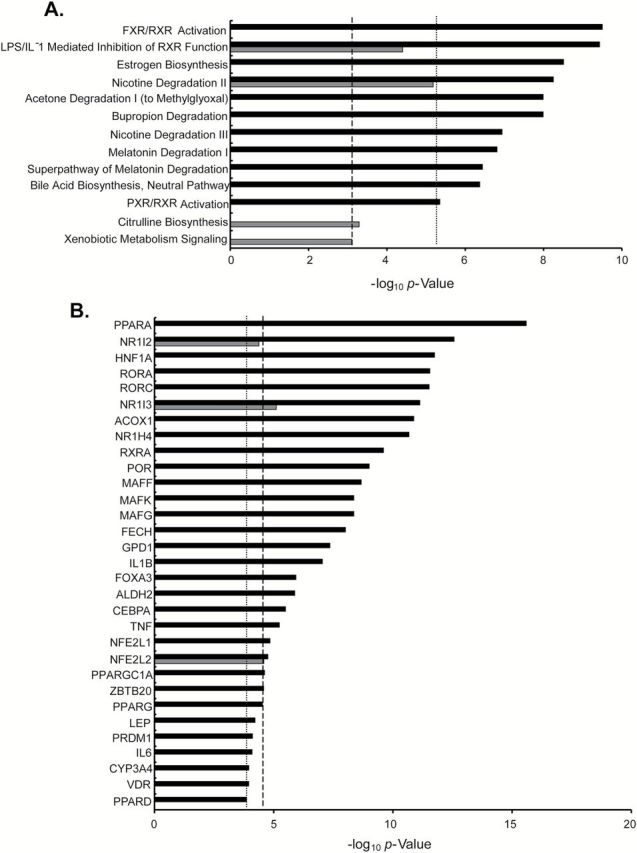
Figure 6.

IPA of placebo/normal and rapamycin/normal. Differentially expressed genes (FDR < 0.05 and fold change ≥ inflection point) were included in the analysis of (A) canonical pathways and (B) upstream regulators. Data are shown as unadjusted P values for placebo/normal (black bars) and rapamycin/normal (grays bars). Thresholds for significance based on analysis of control data sets are shown for placebo (dotted line) and rapamycin (dashed line).
