Figure 1.
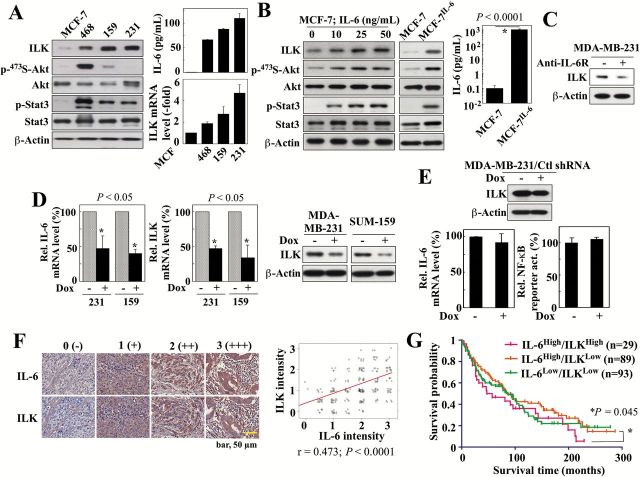
ILK expression correlates with IL-6 levels in breast cancer cell lines and clinical samples. (A) Left, Western blot analysis of the differential expression/activation status of ILK and various IL-6 downstream signaling markers, among four different breast cancer cell lines, MCF-7, MDA-MB-468 (468), SUM-159 (159) and MDA-MB-231 (231). Right, ELISA analysis of IL-6 levels in culture medium (top) and qPCR analysis of ILK mRNA levels in these four cell lines. Data are presented as mean ± SD (n = 3). (B) Western blot analyses of the expression/activation status of ILK and the aforementioned IL-6 downstream signaling markers in MCF-7 cells in response to 24-hour treatment with different concentrations of exogenous IL-6 (left), and in MCF-7 and MCF-7IL-6 cells (middle). Right, ELISA analysis of IL-6 levels in culture medium of MCF-7 and MCF-7IL-6 cells. (C) Western blot analysis of the effect of an IL-6 receptor (IL-6R) neutralizing antibody (10 μg/ml, 72-h treatment) or IgG control antibody on the expression of ILK in MDA-MB-231 cells. (D) qPCR and/or Western blot analyses of the effects of doxycycline (Dox)-inducible shRNA-mediated knockdown of IL-6 on the mRNA expression of IL-6 (left) and the mRNA and protein expression of ILK (center and right) in MDA-MB-231 (231) and SUM-159 (159) cells. Data are presented as mean ± SD (n = 3). (E) Effect of stable expression of non-specific control (Ctl) shRNA in MDA-MB-231 cells on ILK protein abundance (by western blot), IL-6 mRNA levels (by qPCR), and NF-κB reporter activity. Data are presented as mean ± SD (n = 3). (F) Immunohistochemical analysis of IL-6 and ILK in human breast tumors (n = 230) on a TMA. Left, Exemplar images showing cytoplasmic staining for IL-6 and ILK. Staining intensities were semi-quantitatively scored as follows: 0, negative; 1, weak; 2, moderate; 3, strong. Right, Pearson product-moment correlation analysis between IL-6 and ILK expression levels in the same TMA samples. (G) Subgroup analysis showing correlation between high (intensity, 2–3) (n = 29) or low (intensity, 0 < 2) (n = 89) ILK expression and survival time among patients with high IL-6 expression (intensity, 2–3). Data for the IL-6low/ILKlow subgroup is also shown (n = 93). The number of samples from the IL-6low/ILKhigh subgroup (n = 4) was inadequate for analysis.

