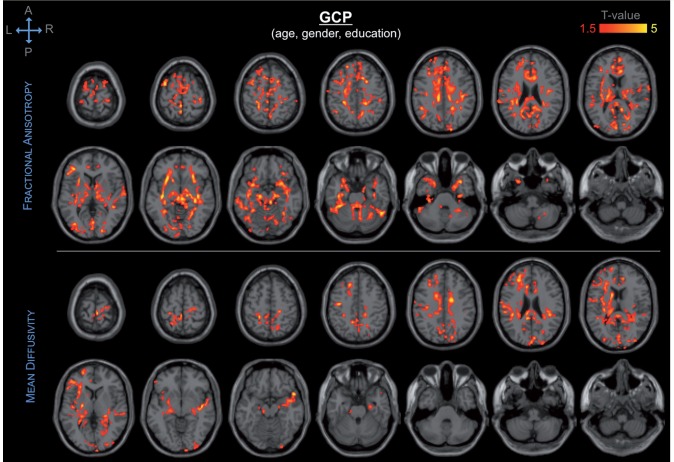
Figure 5.
Spatial distribution and significance of association between DTI abnormalities and GCP, adjusting for age, gender and education. Areas showing decrease in fractional anisotropy (top) and increase in mean diffusivity (bottom) are overlaid to canonical T1-weighted images. Colours refer to T-values of significant DTI abnormalities (P < 0.05 after correction for multiple comparison within each cluster, cluster size ≥ 5000) on a scale of 1.5 (red) to 5 (yellow).

