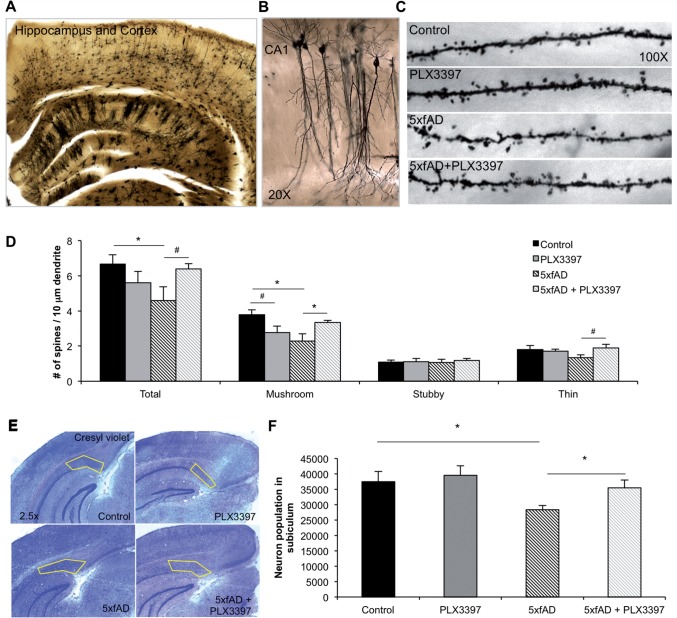
Figure 8.
Microglia modulate dendritic spine number in the CA1 and prevent neuronal loss in the subiculum of 5xfAD mice. (A) Representative ×2.5 image of Golgi staining in hippocampus and cortex. (B) Representative ×20 image of CA1 neurons and dendritic branches. (C) Representative ×100 images of CA1 dendritic branches showing spines. (D) The number of total (two-way ANOVA; P = 0.0337) and mushroom (via two-way ANOVA; P = 0.0091) dendritic spines is significantly decreased in 5xfAD mice, compared to control. 5xfAD + PLX3397 mice show significantly increased mushroom spine density (via two-way ANOVA; P = 0.0416) and a trend for recovery of total spine loss (via two-way ANOVA; P = 0.0561), as well as a trend for increased thin spine density compared to 5xfAD (via two-way ANOVA; P = 0.066). (E) Representative ×2.5 images of Cresyl violet staining with the subiculum outlined in yellow. (F) Stereological quantification of the number of neurons in the 5xfAD group showed a significant decrease in cell number compared to control (two-way ANOVA; P = 0.0181). The neuronal loss in the 5xfAD group is prevented with microglial elimination in the 5xfAD + PLX3397 group (two-way ANOVA; P = 0.0458). Statistical significance is denoted by *P < 0.05 and statistical trends by #P < 0.10. Error bars indicate SEM (n = 3–4/group).

