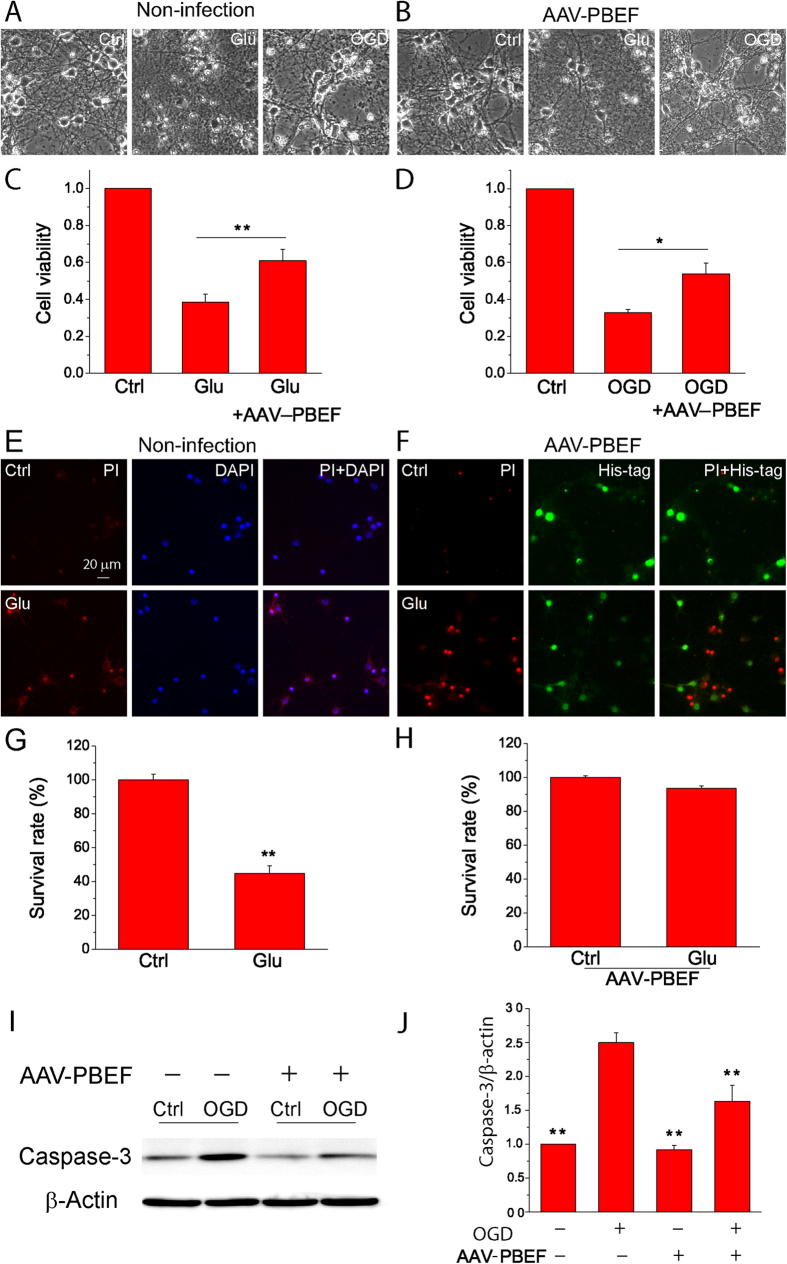
Figure 3. Overexpression of PBEF by AAV infection reduces neuronal death and caspase-3 activation after glutamate and OGD stimulations.
(A,B) Phase contrast images of cortical neurons without (A) and with (B) AAV infection under conditions of control, 24 h glutamate treatment (30 μM glutamate together with 3 μM glycine) and 1 h OGD exposure followed by 24 h reperfusion. (C,D) Summary of neuronal viability after glutamate treatment (C) and OGD (D) by MTT assay. Data are shown as mean ± SE; n = 3–5 independent experiments. **P < 0.01 versus Glu, *P < 0.05, versus OGD ANOVA test. (E,F) Fluorescent images of double staining of PI and DAPI or PI and His-tag in neurons without (E) and with (F) AAV infection under conditions of control and glutamate treatment. (G,H) Summary of cell survival of neurons without (G) and with (H) AAV infection after glutamate stimulation based on PI staining. n = 3 independent experiments. **P < 0.01, t-test. (I,J) Western blot images of cleaved caspase-3 and β-actin (A) and summary data of cleaved capase-3 expression (B). The data were presented as the ratio of caspase-3 to β-actin and normalized to the control condition; n = 4 independent experiments. **P < 0.01 versus OGD without AAV infection (AAV-PBEF), ANOVA test.

