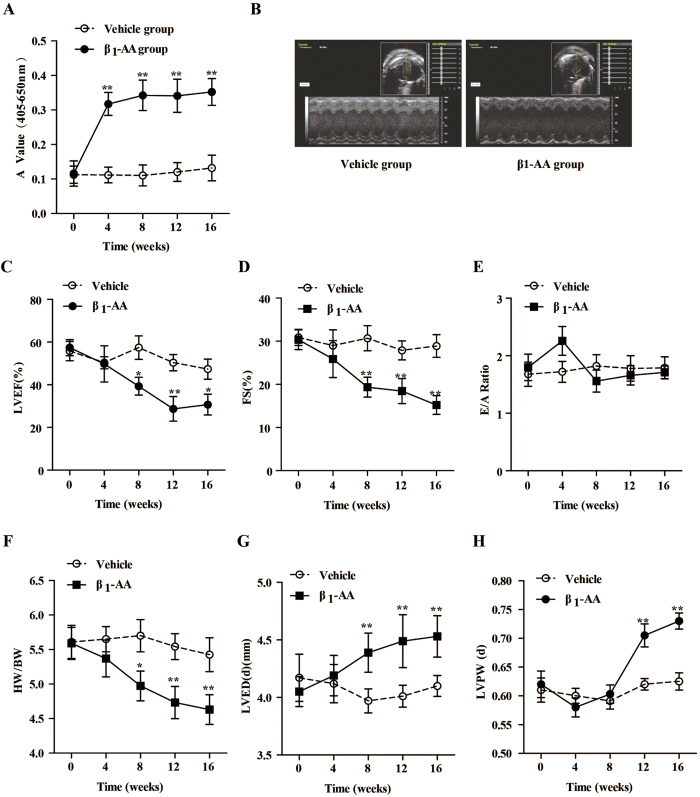
Figure 1. Cardiac function in vehicle and β1-AA positive mice model during treated 16 weeks.
(A) The level of β1-AA at different time points during the treated 16 weeks. (B) Images are representative of echocardiogram at the 16th week. (C–H) The LVEF % (left ventricular ejection fraction), FS% (fraction shortening), E/A ratio, heart weight/Body weight (HW/BW), left ventricular end diastolic dimension (LVEDd, mm) and left ventricular posterior wall end-diastolic thickness (LVPWT, mm) of β1-AA positive group and vehicle group mice during the 16 weeks. Data are presented as mean ± SEM. *P < 0.05 vs. vehicle group, **P < 0.01 vs. vehicle group, n = 8/group at different time points.

