Figure 5.
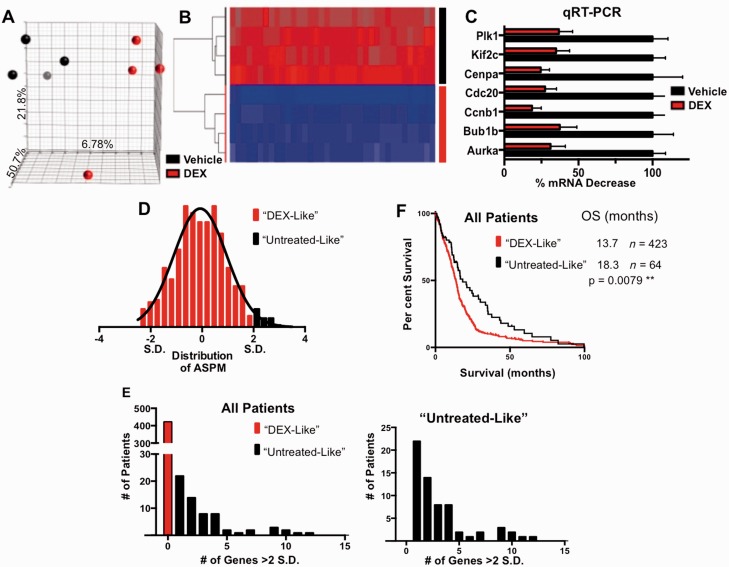
DEX-treated gliomas have downregulation of cell cycle genes, which correlates with poor prognosis in the TCGA dataset. (A) 3D-PCA plot showing control- (black) and DEX- (red) treated samples (n = 4 per each group). The axes of the plot denote the variation accounted for by each component. (B) Heat map and supervised clustering of arrays based on the most significant 25 probes, representing 19 genes. All of the genes are strongly downregulated in DEX-treated samples. (C) Validation of seven DEX downregulated genes by quantitative reverse transcription polymerase chain reaction (qRT-PCR). All samples are normalized to TBP expression levels. ****P < 0.0001 for all comparisons, determined using one-way ANOVA. (D) Representative distribution of TCGA-samples by abnormal spindle-like, microcephaly-associated (ASPM) gene expression, based on z-scores normalized to diploid samples. Patients with elevated expression levels >2 SD above the mean were considered minimally DEX-responsive. This process was repeated for the most significantly DEX-regulated genes. (E) Distribution of patients based on classifications as described above, showing the number of patients with high expression of 0–15 DEX-regulated genes. The graph (right) does not include the 423 (87%) patients who had no genes expressed above our threshold. This more clearly shows the distribution of minimally DEX-responsive patients. (F) Minimally DEX-responsive patients have significantly better overall survival rates (18.3 versus 13.7 months). P-values were calculated using a Log-rank (Mantel-Cox) test, **P < 0.01, *P < 0.05. OS = overall survival.

