Figure 6.
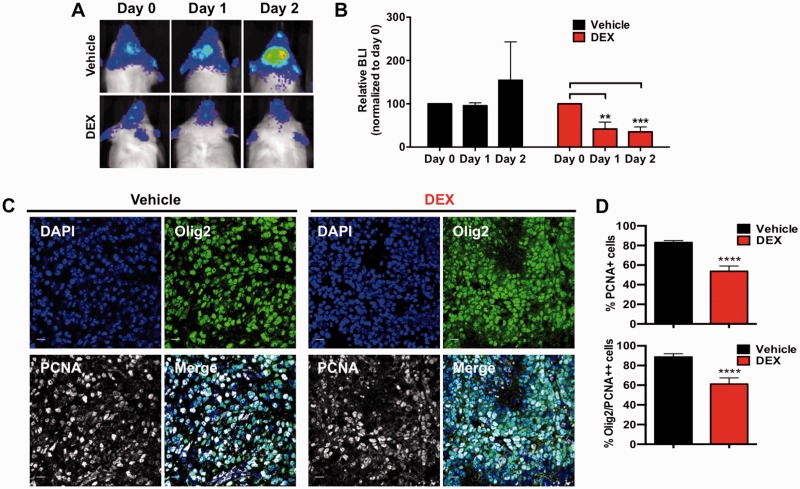
DEX suppresses proliferation of glioma cells in PDGF-driven murine gliomas. Representative bioluminescence images (BLI) of individual Ntv-a/Ef-Luc mice with PDGF-driven gliomas treated with either vehicle or with DEX at 10 mg/kg (B). DEX-treated mice received three total doses: at Day 0 (immediately after BLI), Day 1, and Day 2 (1 h pre-BLI). The bar graph shows that DEX treatment significantly decreased BLI output whereas vehicle treatment did not. Each group had n = 3 mice, values were normalized to day 0. (C) Representative tumour sections and (D) quantification of glioma proliferation using Olig2 expression as a glioma cell marker and PCNA as a proliferative marker. Data in upper panel are presented as the % of PCNA positive cells in total (based on nuclei count by DAPI per field) and the lower panel is the % of PCNA/Olig2 double positive cells in total PCNA positive cells per field. P-values were calculated by paired ANOVA analyses within each group, **P < 0.01, ***P < 0.001 for B by unpaired Student’s t-test, ****P < 0001 for D. Scale bars = 50 μm in C.

