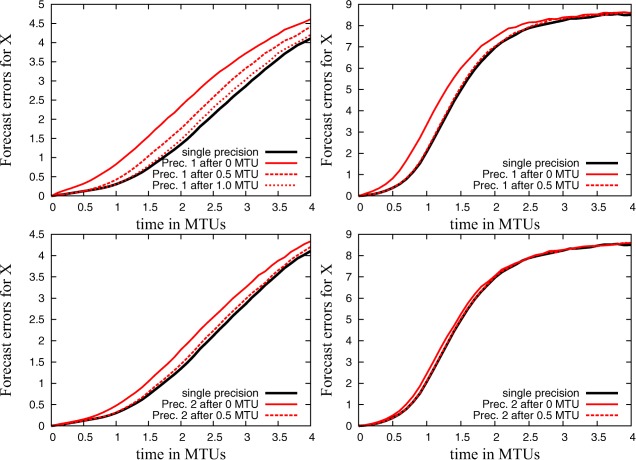
Figure 7.

Short‐term forecast error for simulations with single precision and simulations for which precision is reduced to either (top) EX = EY = 6 and PX = PY = 12 (Prec. 1) or (bottom) EX = EY = 5 and PX = PY = 13 (Prec. 2) after 0, 0.5, or 1.0 MTUs for the configuration (left) C4 and (right) C10.
