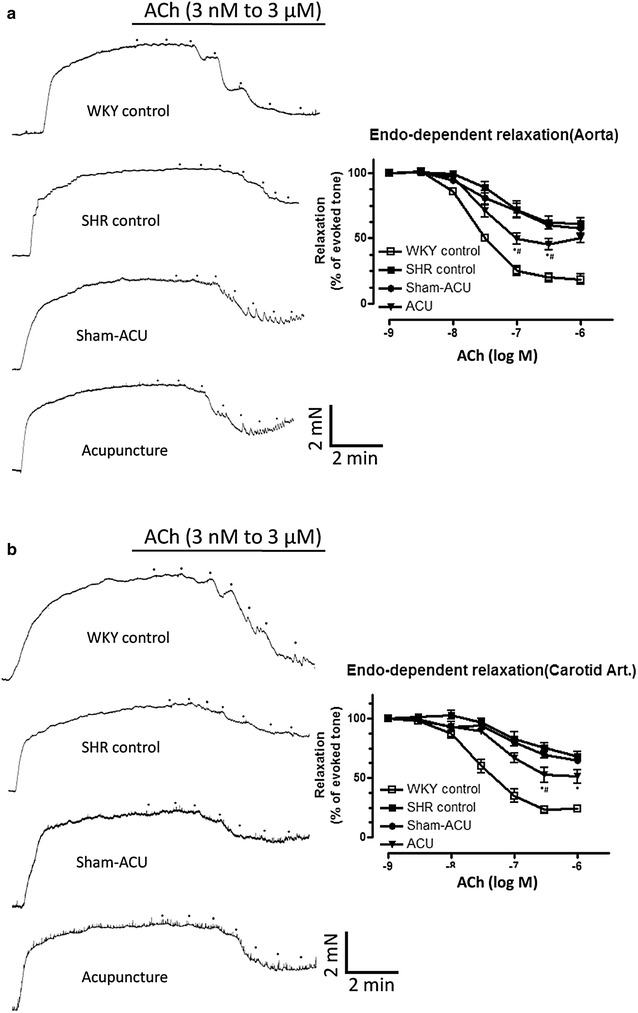
Fig. 2.

The cumulative concentration–response curves for Ach-induced relaxations of different groups in aorta (a) and carotid (b) arteries. Data were expressed as means ± SD. (For aorta at ACh[log M] concentration of −6.5,*P = 0.024 for ACU vs. SHR control and # P = 0.019 for ACU vs. sham-acupuncture. At ACh[log M] concentration of −7, *P = 0.018 for ACU vs. SHR control and # P = 0.0095 vs. sham-acupuncture. For carotid artery at ACh[log M] concentration of −6,*P = 0.045 for ACU vs. SHR control. At ACh[log M] concentration of −6.5, *P = 0.022 for ACU vs. SHR control and # P = 0.05 for ACU vs. sham-acupuncture)
