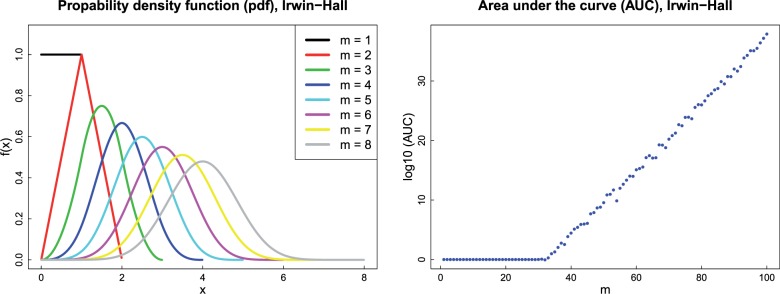
Fig. 1.
Probability density functions (pdf) of the Irwin-Hall distribution (left panel) and the area under the pdf curve (AUC) (right panel), for different values of m. The left panel shows the density of X, when . For each value of m, the density function is symmetrical and takes values between 0 and m. The right panel shows the area under the pdf curve calculated by a 64-bit implementation of R (version 3.1.1, 2014-Jul-10). For each value of m, the AUC should be 1 and therefore the should be 0. However, due to the complexity of the Irwin-Hall formula and arithmetic underflow, the calculation is not accurate for large values of m and the AUC increases very rapidly. The figure shows that the calculation is completely unreliable when m > 30

