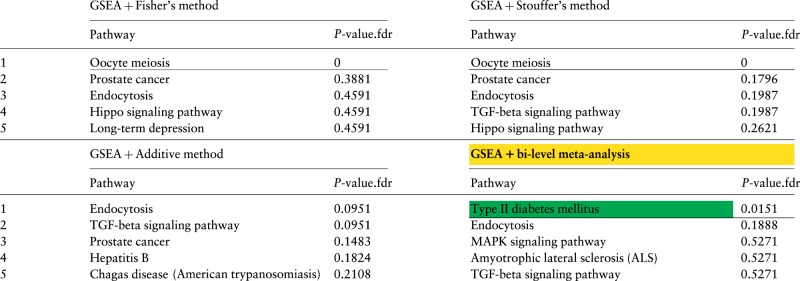
Table 1.
Results of combining GSEA P-values using 4 meta-analysis approaches for type II diabetes data
 |
The top 5 pathways and their FDR-corrected P-values obtained by combining the P-values of GSEA using 4 meta-analysis approaches: Fisher’s, Stouffer’s, the additive method and bi-level meta-analysis. In the first three approaches, the 5 P-values for a pathway (one of each of the 5 datasets) were combined into a single p-value using Fisher’s, Stouffer’s, or the additive method. This is done for all of the 150 signaling pathways in KEGG. The P-values are then adjusted for multiple comparisons using FDR. The pathways are sorted by the combined P-values, from low to high. The horizontal lines show the 5% significance threshold. The target pathway Type II diabetes mellitus is highlighted in green. The target pathway Type II diabetes mellitus is the only significant pathway using the bi-level meta-analysis. The three classical approaches, Fisher’s, Stouffer’s and the additive method, fail to identify the target pathway as significant and rank it in positions 7th, 10th and 12th, respectively.
