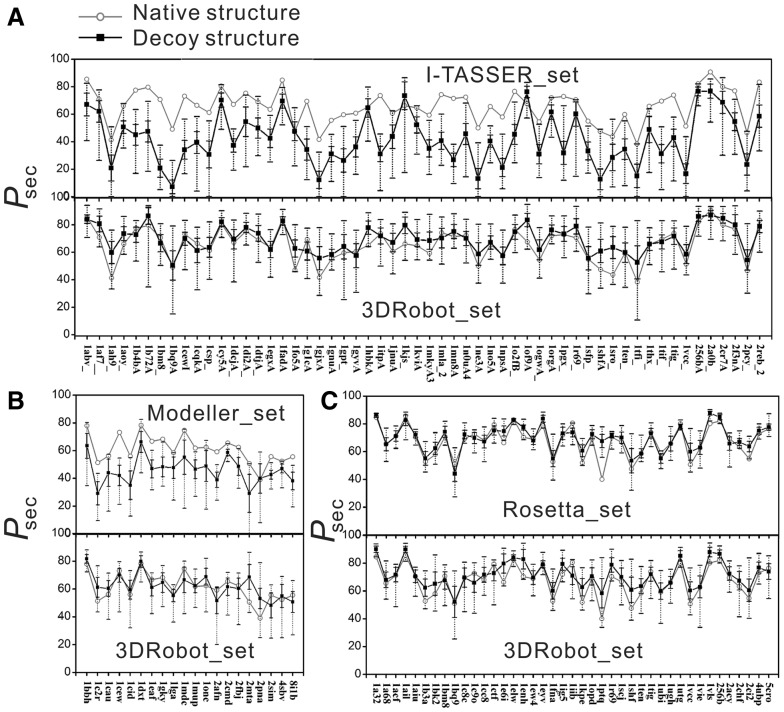
Fig. 4.
Comparison of 3DRobot and control decoy sets on secondary structure distribution (Psec) relative to the native structure. Open circles are Pset value for native structure and solid squares are the average Psec for decoy conformations. The solid error bar denotes the standard deviation of Psec for each decoy set. The dotted line with bar shows Psec range of each decoy set. (A) I-TASSER_set; (B) Modeller_set; (C) Rosetta_set

