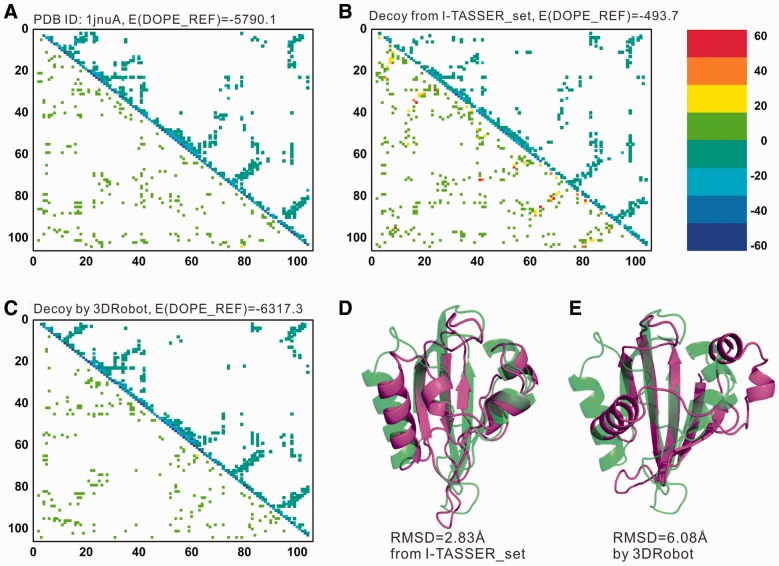
Fig. 7.
An illustrative example showing Dope_REF energies of the structure decoys by I-TASSER and 3DRobot. (A–C) X- and Y-axes are the residue order number. Energy for residue pair is calculated as the sum of energies of all atom pairs between the two residues. The upper triangle of each plot shows the energetically favorable residue pairs (energy<−3.0), and the lower triangle of each plot shows the energetically unfavorable residue pairs (energy > 3.0). Residue pairs with energy between −3.0 and 3.0 are not shown. Different colors are used to illustrate energy variation. (D–E) structure decoys by I-TASSER_set and 3DRobot (red) superposed on the native structure of 1jnuA (green)

