
Fig. 4.
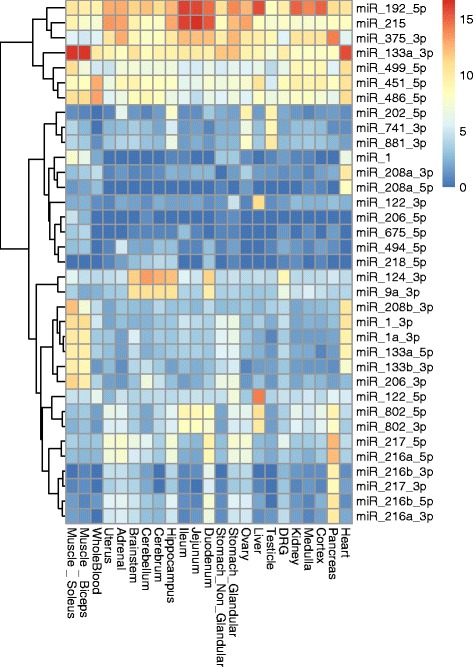
Heat map of tissue specific and tissue enriched miRNAs. Examples of tissue specific and enriched miRNAs identified by this and previously published studies are displayed with tissues on the x-axis and miRNAs listed on the y-axis. MiRNA expression from least to highest expression is indicated as a shift from blue to red with blue representing the least expression and dark red indicating maximal expression