
Fig. 5.
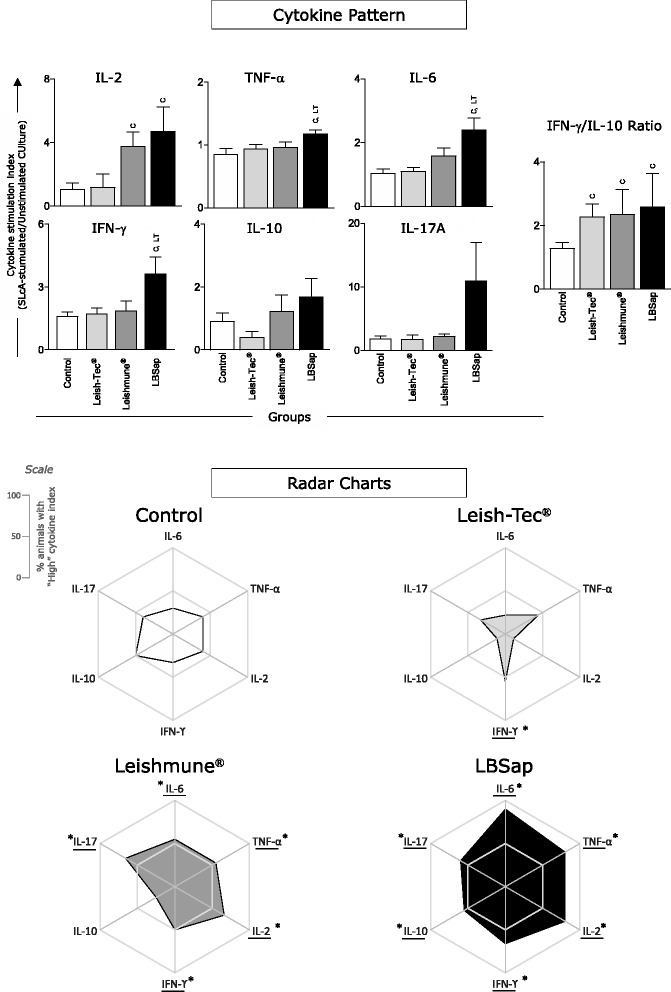
Overall proinflammatory and regulatory cytokine patterns secreted by splenocytes from BALB/c mice immunized with the multicomponent LBSap vaccine, Leish-Tec® or Leishmune®. In the upper panel, the x-axis displays the index (SLcA stimulated culture/unstimulated culture) of each analyzed cytokine (IL-6, TNF-α, IL-2, IFN-γ, IL-10, IL-17A) 30 days after experimental L. infantum challenge in the different analyzed groups (n = 5 mice/group in two independent batches) (Control [□]; Leish-Tec® [ ]; Leishmune® [
 ]; and LBSap [killed L. braziliensis vaccine plus saponin; ■]). The y-axis represents the mean values (with standard deviations) of the stimulation index of analyzed cytokines. Significant inter-group differences are marked by letters (C: Control group and LT: Leish-Tec® group). The bottom panel displays radar charts of proinflammatory and regulatory cytokines from splenocyte supernatant culture. Each axis displays the proportion of high-producing cytokines in the following groups (n = 5 mice/group in two independent batches): Control (□); Leish-Tec® (
 ); Leishmune® (
 ); and LBSap (killed L. braziliensis vaccine plus saponin; ■)