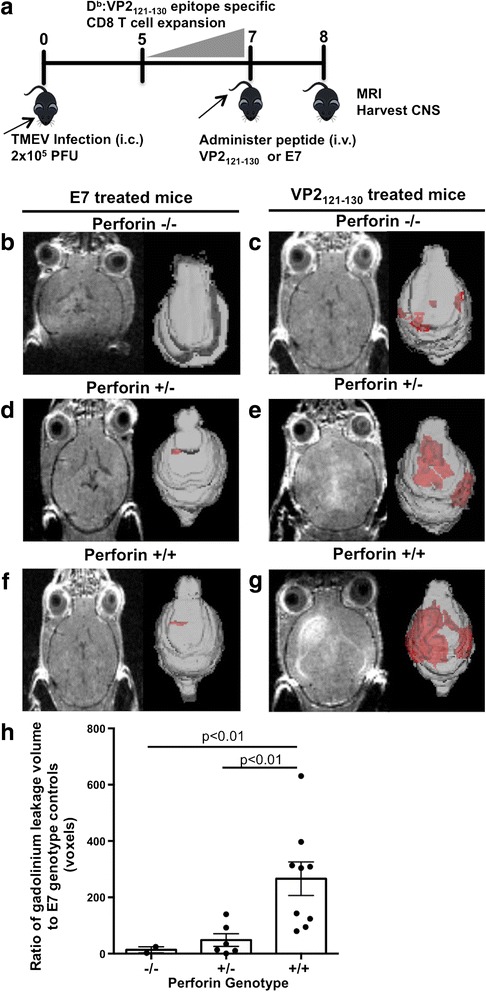
Fig. 2.

Perforin gene dosage proportionally affects CNS vascular permeability as measured by gadolinium-enhanced T1-weighted MRI. a Perforin−/−, perforin+/−, and perforin+/+ mice were evaluated in the PIFS model. On day 8, 12 h post viral peptide, VP2121-130, or mock E7 peptide, all mice were subjected to gadolinium-enhanced T1-weighted small animal MRI. b–g Representative animals are shown for raw MRI image and 3D reconstruction showing the area of gadolinium enhancement in red. h Gadolinium enhancement was quantified and plotted. The group sizes for VP2121-130-exposed peptide mice were as follows: n = 3 perforin−/− mice, n = 6 perforin+/− mice, and n = 9 perforin+/+ mice. All perforin genotypes treated with the VP2121-130 peptide were standardized corresponding to the genotype treated with the E7 peptide-treated control (n = 3 per group). Significance was determined using Student’s T test with Welch’s correction. p < 0.05 considered statistically significant
