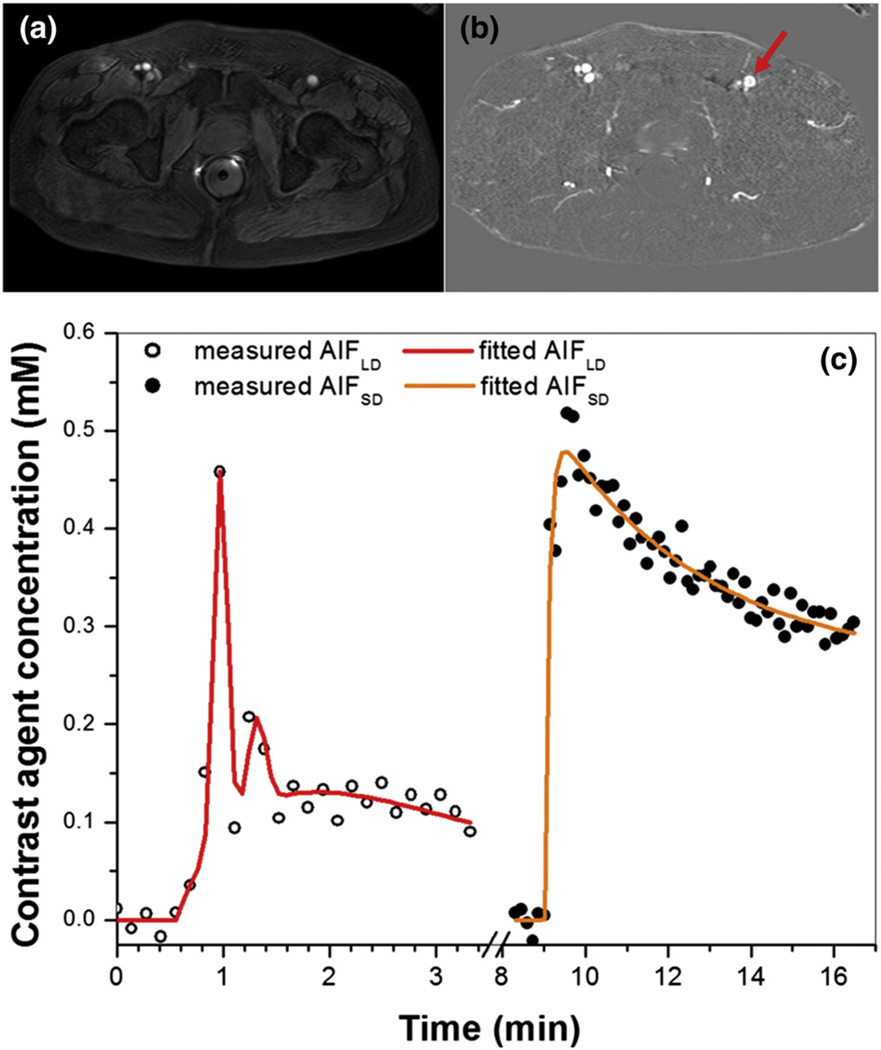
Fig. 1.
(a) An axial slice imaged with pre-contrast agent (low dose) injection DCE-MRI, (b) difference image between post and pre-contrast agent injection, and (c) corresponding AIFs from femoral artery (indicated by red arrow). Plots of AIFs measured from low dose (open circles) and standard dose (solid circles) contrast administration are plotted, as well as the corresponding fits by the EMM models (red and orange lines) for a representative subject. Note that AIDLD did not scale by the contrast agent dose ratio of 5.67. The plots were displayed in the order of DCE-MRI acquisition.

