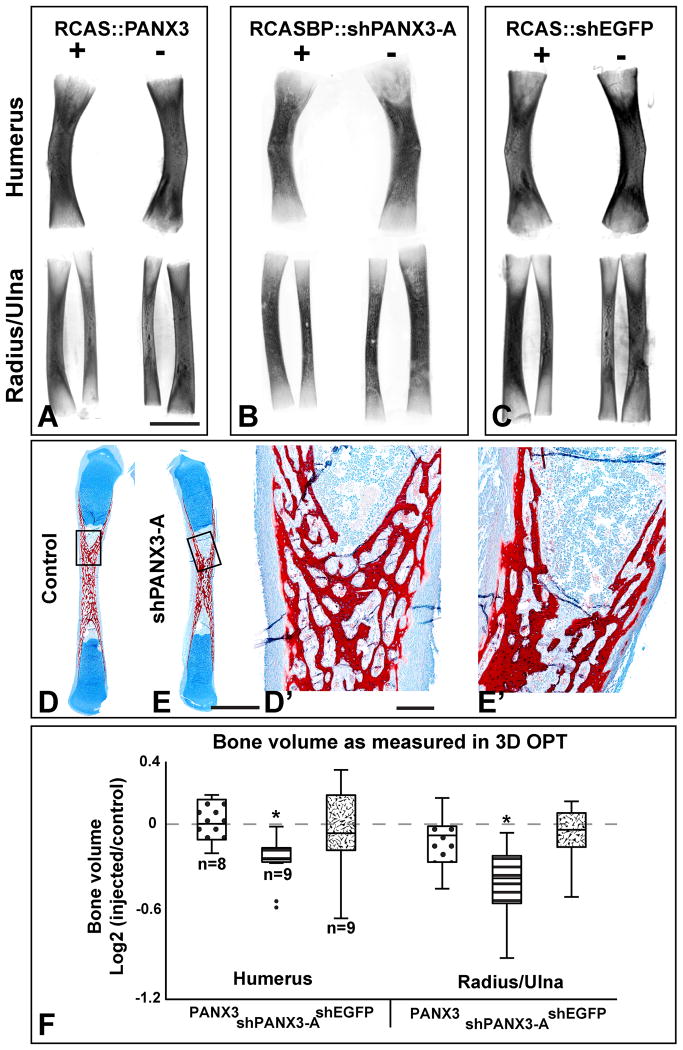
Figure 3. OPT scans of stage 40 forelimb bones.
Representative images of humerus (top) and radius/ulna (bottom) taken from the injected (right side, +) and contralateral (left, -) limb of the same animal. All limbs stained with Alizarin red, cleared in BABB and scanned on the red channel to reveal fluorescence. These are projections of the full 3-D scan. Limited information can be obtained about the trabecular pattern due to lack of penetration of the UV light. A) Wild-type RCAS∷PANX3 does not cause a change in volume. B) shPANX3 virus causes a reduction in size of forelimb bones. C) A virus containing a shEGFP cassette resulted in limbs of similar sizes. D-E′) Resin sections through the radii of stage 40 embryos, stained with Alcian Blue for cartilage and Alizarin red for bone. The red trabecular patterns in the diaphysis are indistinguishable.F) A whisker plot showing the bone volume of each sample comparing the injected (I) to its contralateral control (C; I/C score = log2[I/C]). An I/C-score of 0.0 indicates that the injected and control bones are the same size. PANX3 and shEGFP viral infection did not alter bone volume, while shPANX3 injection was correlated with a significant reduction of about 20%. Plus and minus symbols indicate the presence or absence of virus injection. Asterisks indicate p < 0.01, 1-sample, 2-tailed t-test. Dots represent valued that fall outside of the 95th percentile. Scale bar = 500 μm.

