Figure 2.
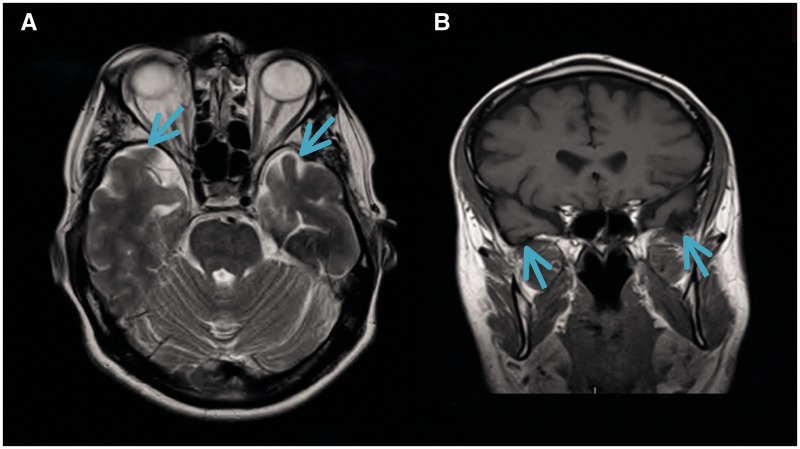
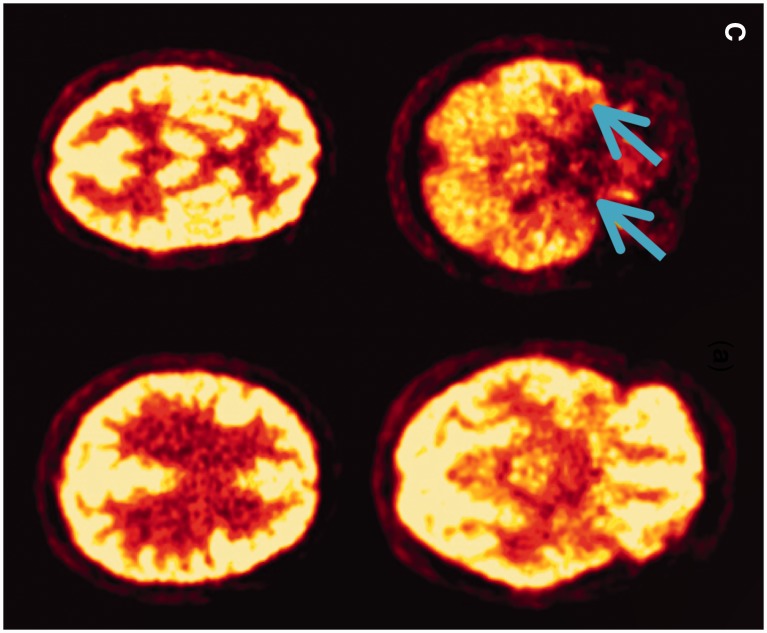
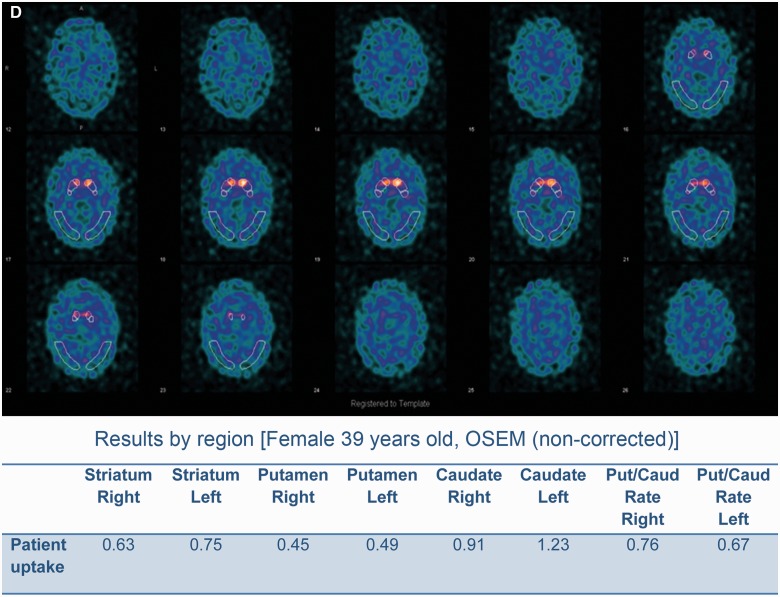
Morphological and functional brain imaging of proband (Patient IV-1) and proband's sister (Patient IV-2). (A) MRI brain (axial T2) showing bilateral mild-to-moderate temporal atrophy indicated by arrow (proband Patient IV-1). (B) MRI brain (coronal T1) showing bilateral mild temporal atrophy more pronounced on the left side, indicated by arrow (proband Patient IV-1). (C) FDG-PET scan displaying bilateral reduction in temporal tip activity indicated by arrow with normal frontal and parietal uptake (Proband Patient IV-1; Fig 1). (D) Nuclear medicine brain dopaminergic system imaging (123I-FP-CIT DAT scan) of the proband’s sister (Patient IV-2; Fig 1). Radiotracer uptake in the striatum was quantified and compared to background activity using automated GE software. Specific ratio values (basal ganglia nucleus compared to background activity) <2.0 may be considered abnormal.


