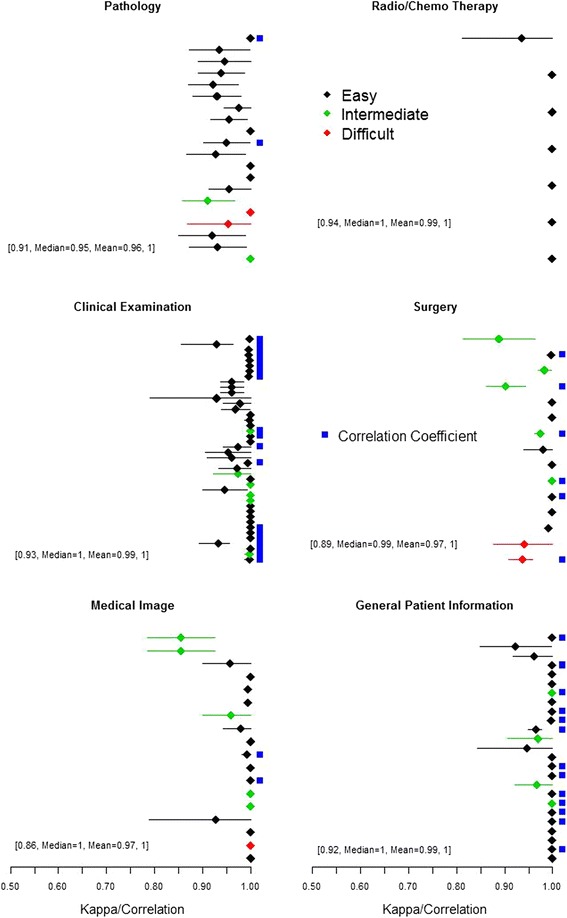
Fig. 5.

Estimated reproducibility parameters (Kappa statistics for categorical variable and Correlation for continuous variable, denoted by blue square next each row) computed for 127 variables (rows) in six modules (Pathology, Radio/Chemo therapy, Clinical examination, Surgery, Medical image and General patient information). The line denotes 95 % confidence interval. A visual absence of the line implies that very narrow confidence interval. The difficulty level of extracting variable is categorized as easy (black), medium (green) and difficult (red). Within each dot-line plot, a string of texts and numbers provides the range of reproducibility parameters, median and mean, for all variables within the module
