Fig. 5.

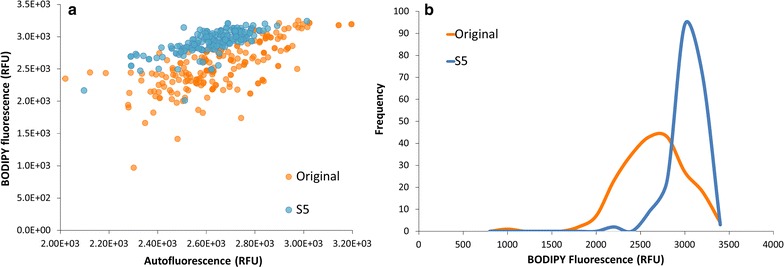
Comparing growth and lipid accumulation of original and S5 under simulated Dutch summer conditions. Graph a shows that the S5 strain produces more biomass under nitrogen starvation than the Wt. The grey area represents the period of the cultivation in which N was available, hence both populations consumed nitrogen at the same rate. From day 2 onward the N-starvation phase (N−) is considered. Error bars are depicted at each time point (standard deviation, three replicates), although for most of the points the bars are too small to be visualized. Graph b shows the difference between S5 and original at cellular level (at the end of the N-starvation period): the S5 population has higher values of Bodipy fluorescence than the Wt, leading to an increase in the BP/AF ratio. Both populations had the same number of cells analyzed (n = 500). Error bars at figure b represent the 95 % confidence intervals
