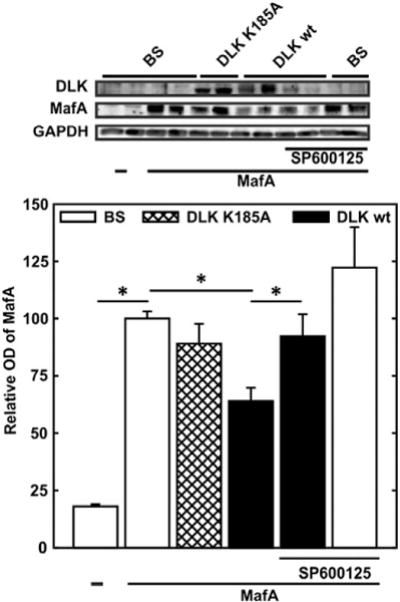
Fig. 4.

Effect of DLK on MafA protein content. Upper panel – typical immunoblot, lower panel – quantitative evaluation. JEG cells were transiently cotransfected with an expression vector for MafA (2.5 μg) together with expression vectors for DLK wild-type (DLK wt) (2.5 μg) or its kinase-dead mutant (DLK K185A) (2.5 μg) as indicated. In addition, when indicated, cells were treated with the JNK inhibitor SP600125 (25 μM) 16 h before harvest. Cell extracts were subjected to immunoblot analysis and the optical density of the respective bands was evaluated. Optical density (OD) of MafA is expressed relative to the mean value of the optical density of overexpressed MafA in the absence of DLK wt or DLK K185A in each experiment. Values are means ± SEM of three independent experiments each done in duplicate. *p < 0.05 vs. control.
