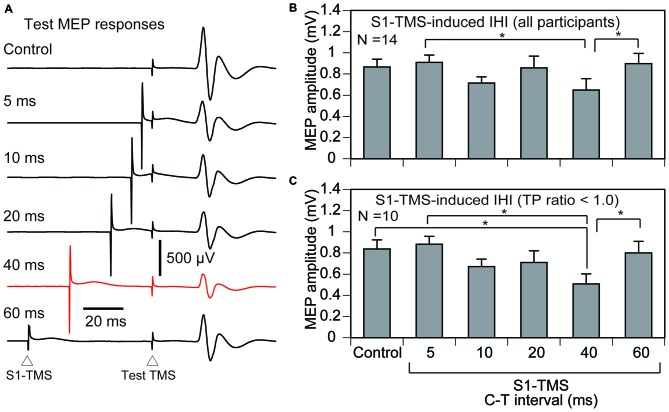
Figure 4.
The averaged test MEP responses (A), the averaged test MEP amplitudes under the S1-TMS and control conditions across the participants (B), and those in the participants with the TP ratio less than 1.0 (C). The bar at the left side indicates the mean test MEP amplitude in the trials without the S1-TMS (control condition), and the other bars indicate the mean test MEP amplitudes in the trials with various C-T intervals of the S1-TMS (S1-TMS condition) (B,C). Error bars indicate standard errors. Asterisks indicate significant differences (p < 0.05). MEP, motor evoked potential; S1, primary sensory area; TMS, transcranial magnetic stimulation; DS, tactile stimulation to the index finger; M1, primary motor area; C-T interval, conditioning-testing interval.

