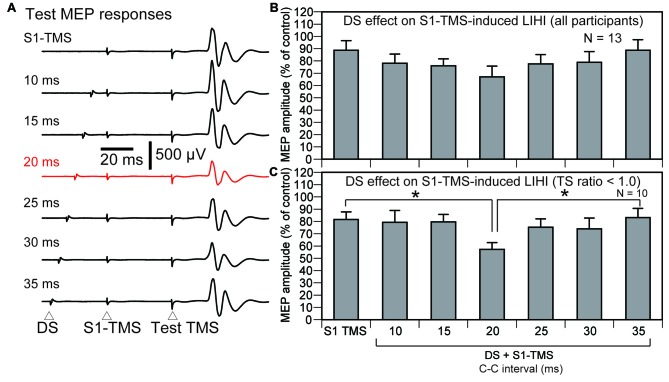
Figure 8.
The averaged test MEP responses (A) and the S1-TMS-induced LIHI with and without the DS across the participants (B) and in the participants with the TP ratio less than 1.0 (C) in Experiment 2. A red trace indicates the MEP response prominently inhibited (A). The bar at the left side indicates the mean test MEP amplitude under the S1-TMS condition, and the other bars indicate the mean test MEP amplitudes in the various C-C intervals under the DS + S1-TMS condition (B,C). Error bars indicate standard errors. An asterisk indicates significant difference (p < 0.05). MEP, motor evoked potential; S1, primary sensory area; TMS, transcranial magnetic stimulation; DS, tactile stimulation to the index finger; C-C interval, conditioning-conditioning interval.

