Figure 7.
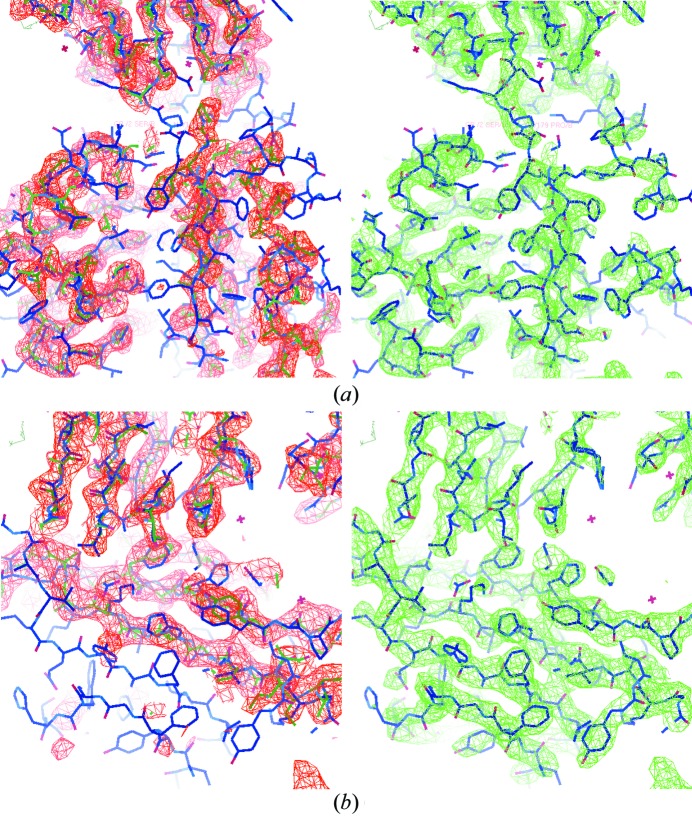
The initial and the final calculated electron-density maps of 3on5 at 2.8 Å resolution with the PDB-deposited structure superimposed. The initial map is in red in the left panels and the final map is in green in the right panels. The target structure is superimposed as the blue wireframe. The template model is shown as the green wireframe in the left panels.

