
Figure 1.
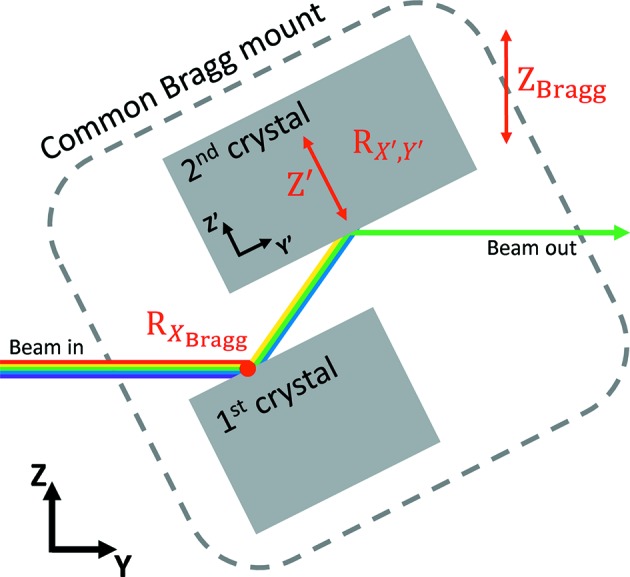
Schematic presentation of the HDCM’s degrees of freedom (not to scale). The white, rainbow-colored, beam enters from the left and the monochromatic beam exits at the right. Red letters indicate motion. The Bragg rotation axis is indicated by a red dot on the surface of the first crystal.