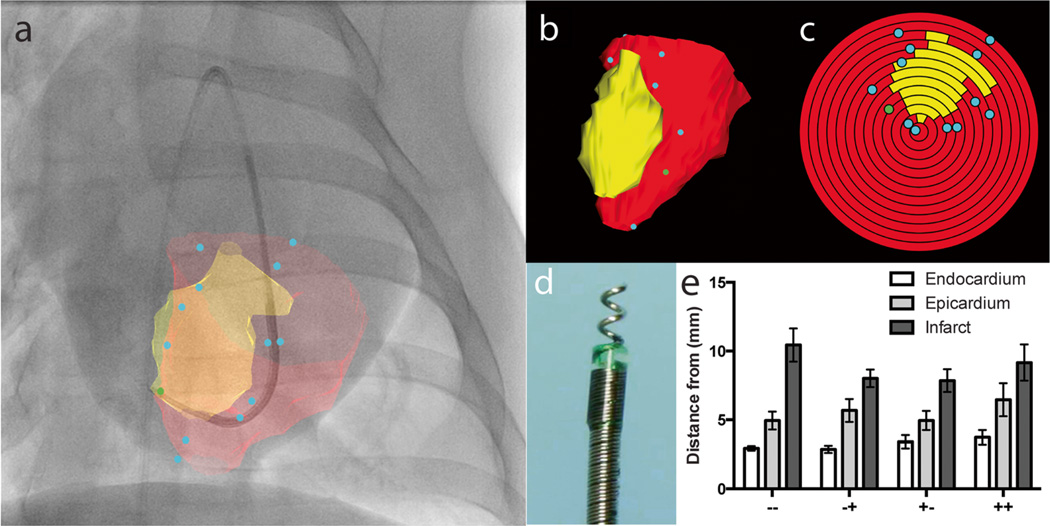
Fig. 4.
Bi-plane X-ray fluoroscopy fused with MRI guided transendocardial injections. a Intraoperative display of MRI endocardial (red) and infarct (yellow) surface registered and projected on to live X-ray fluoroscopy in the anterior-posterior view. Blue dots indicate the injection locations. b Three dimensional surface rendered volume in an oblique view and c corresponding polar plot of injection locations. The apex of the ventricle represents the center of the polar plot. d Corkscrew-shaped needle tipped Helix transendocardial injection catheter. e Mean distances of injection location to the closest endocardial, epicardial, and infarct surface across all treatment groups. IV placebo plus TE placebo (−−), IV Placebo plus TE MSC (−+), IV MSC plus TE placebo (+−), and IV MSC plus TE MSC (++)

