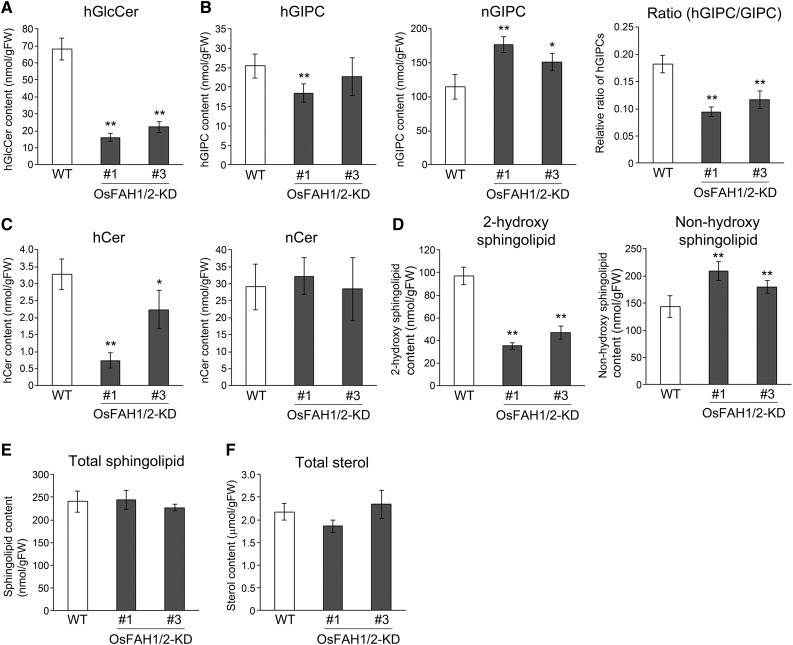
Figure 1.
Sphingolipid and Sterol Content in OsFAH1/2-KD Lines.
Total lipids were extracted from wild-type and OsFAH1/2-KD suspension cells, and the indicated lipids were quantified by LC-MS/MS. Data are means ± sd (n = 4). Asterisks indicate significant differences compared with the wild type (Student’s t test; *P < 0.05, **P < 0.01).
(A) to (D) Amounts of each sphingolipid class ([A], GlcCer; [B], GIPC; [C], Cer; [D], total sphingolipid) are shown for 2-HFA- (“h” prefix) and NFA-containing (“n”) types; no GlcCer-containing NFA was detected in this study. For GIPC, the ratio of hGIPC to total GIPC is also shown.
(E) Total sphingolipid content, comprising both 2-hydroxy sphingolipids and non-hydroxy sphingolipids.
(F) Amount of total sterols.

