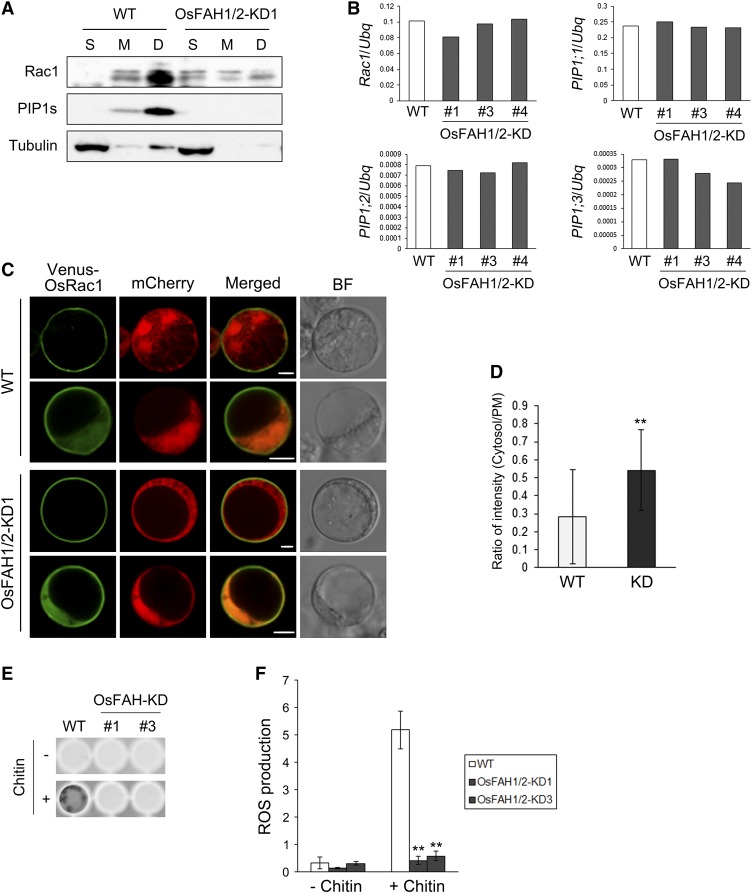
Figure 6.
Intracellular Localization of Os-Rac1 and Production of ROS in the OsFAH1/2-KD.
(A) Immunoblot analysis of Rac1, PIP1s, and tubulin in wild-type and OsFAH1/2-KD1 suspension cells. S, M, and D indicate soluble, microsomal, and microsomal DRM-like fractions, respectively.
(B) qRT-PCR of Rac1, PIP1;1, PIP1;2, and PIP1;3 in wild-type and OsFAH1/2-KD1 suspension cells.
(C) Subcellular localization of Venus-OsRac1 in rice protoplasts extracted from the wild type and OsFAH1/2-KD1. The upper row for each cell type exemplifies localization mainly at the PM, and the lower row exemplifies localization mainly in the cytosol and nucleus. mCherry was used as a cytosolic and nuclear marker. BF, bright field. Bars = 5 μm.
(D) Ratio of the fluorescence intensity of the cytosol to that of the PM. Data are means ± sd (n ≥ 18). Asterisks indicate a significant difference compared with the wild type (Student’s t test; **P < 0.01).
(E) Example of ROS detection in rice suspension cells by L-012 reagent.
(F) Quantification of ROS production in OsFAH1/2-KD suspension cells. Intensity of each well was measured by ImageJ software (http://rsbweb.nih.gov/ij/). Data are means ± sd (n = 4). Asterisks indicate significant differences compared with the wild type (Student’s t test; **P < 0.01).

