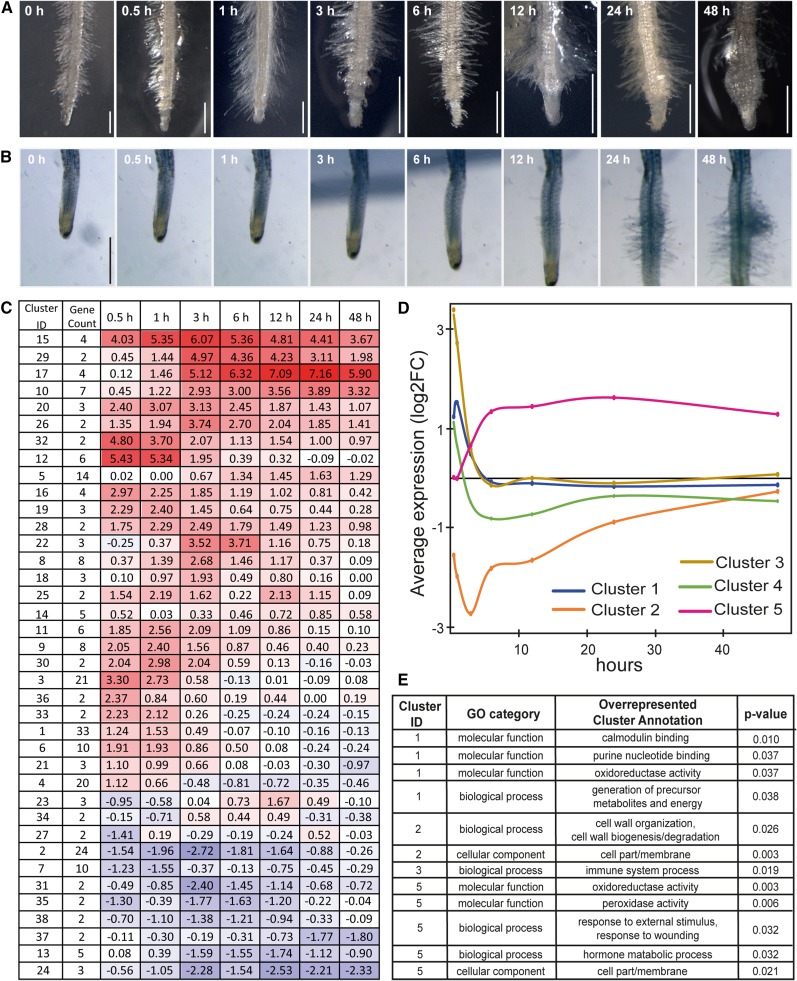
Figure 2.
Changes in Root Morphology and Gene Expression in Response to DMBQ Treatment.
(A) Morphological changes in P. japonicum roots exposed to 10 µM DMBQ.
(B) Time-lapse photographs of the haustorium after treatment with rice root exudate. The full-length movie is shown in Supplemental Movie 1. Bars = 500 µm.
(C) The average transcript abundance for all DE genes at each time point across three biological replications. The first column contains the unique cluster ID (Cluster ID) and the second column contains the number of unigenes belonging to each cluster (Gene Count). Colored boxes highlight the averaged expression values shown as log2 FC (fold change between DMBQ-treated/control [0 h]) across three biological replicates throughout the time course. Colors are based on a scale with red indicating upregulation and blue indicating downregulation. Rows were placed manually according to the cluster similarity. The unigenes in each cluster are listed in Supplemental Data Set 2.
(D) A graph of the expression profiles of the five largest clusters.
(E) Enriched gene ontology terms according to Fisher’s exact test (Benjamini and Hochberg-corrected FDR < 0.05).

