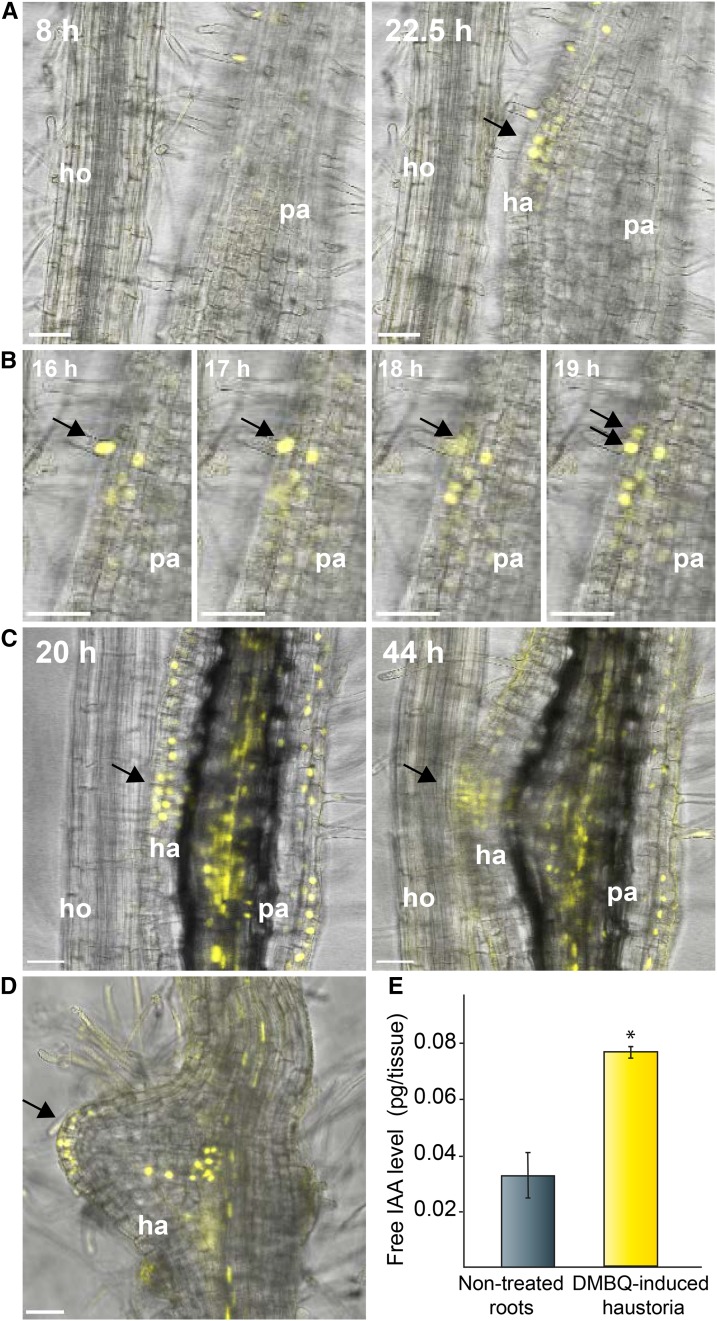
Figure 6.
Time-Lapse Observation of the Expression Pattern of DR5 Auxin-Responsive Promoter during Early Haustorium Development.
(A) to (D) Confocal images of P. japonicum roots transformed with pDR5rev:3xVenus-N7. Merged images of bright-field and Venus fluorescence (yellow) are shown.
(A) Arrow indicates newly established auxin maximum at haustorium initiation site facing the host root.
(B) Arrows track nucleus of a dividing root hair cell.
(C) and (D) Arrows indicate DR5 expression at haustorium apex. Maximum intensity projection images were used for Venus fluorescence. Images were derived from the complete time-lapse videos (Supplemental Movies 5 and 6). The numbers at the top left indicate time post host application or time post DMBQ application in each experiment. Bar = 50 µm. pa, parasite; ha, haustorium; ho, host root.
(E) IAA levels measured in DMBQ-induced haustoria region (0.5 to 1 mm from root tips) compared with the corresponding region in nontreated roots. Data are mean values of three biological replicates with 100 excised tissues for each experiment. An asterisk indicates significantly different at α ≤ 0.05 by Student’s t test with equal variances (P value < 0.0008). Error bars denote standard errors of the mean among three biological replicates.

