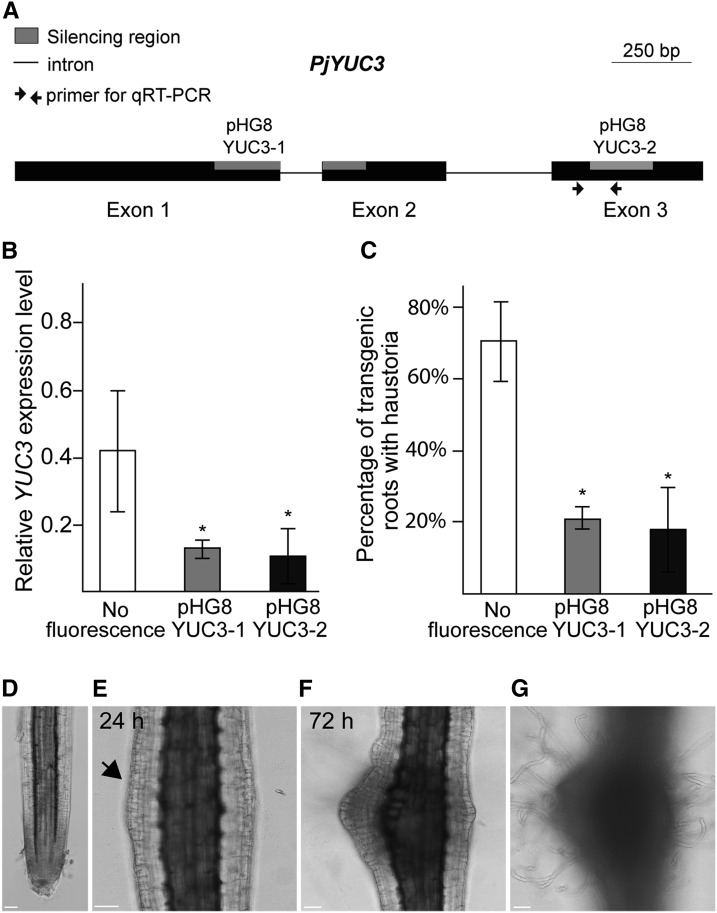
Figure 7.
YUC3 Expression Levels Positively Correlate with Haustoria Formation.
(A) Schematic view of the YUC3 gene. Exons are shown as black boxes, introns are shown as simple lines, primer pairs used for RT-qPCR analyses are indicated with arrows, and the gray boxes correspond to target regions for silencing constructs. Bar = 250 bp.
(B) Transcriptional levels of YUC3 in host-induced transgenic roots. Values represent the relative expression levels normalized by the internal control Pj-PTB. The controls are cotyledon-emerged hairy roots with no florescence.
(C) Percentage of transgenic roots that formed at least one haustorium when placed next to Arabidopsis roots. Values are means (±se) of three to five biological replicates. Each replicate had 5 to 15 independently transformed roots. Asterisks indicate significant difference at α ≤ 0.05 by Student’s t test with equal variances. Error bars denote standard errors of the mean among three biological replicates.
(D) to (G) Transgenic hairy roots with the AtPGP4>>PjYUC3 construct. Confocal bright-field images of the root before DEX treatment (D), 24 h after 10 µM DEX treatment, with an arrow indicating cell division in the epidermis (E), and 72 h after DEX treatment (F) are shown. Surface focal plane is shown in (G) to focus on hair cells. Bar = 50 µm.

