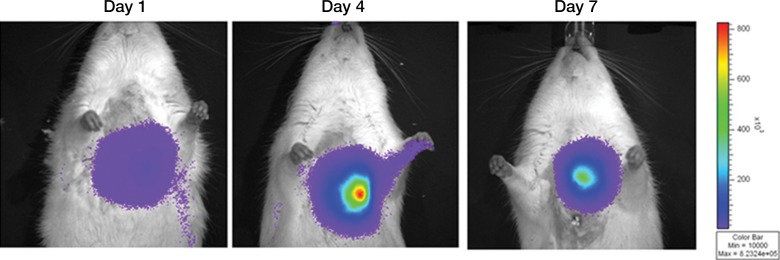
Figure 4g:
Optical imaging of transplanted MSC in a small-animal model of MI. (a) In vivo bioluminescence image of representative nude mice subcutaneously injected with various amounts of triple-sorted MSC-TF shows mice injected with between 1 × 10³, 5 × 10³, and 5 × 10⁴ MSC-TF, as labeled. The imaging parameters were as follows: medium binning; field of view, 12 cm; f-stop, 1; and time, 20 seconds. (b) Graph shows quantitation of bioluminescence images in a by using the maximum radiance (photons per second per square centimeter per steridian) for each injection and the plotted means ± standard deviations for eight cell numbers (two injections per cell number) (there were 16 injections in eight mice; correlation coefficient = 0.995, P = .0001). (c) Serial in vivo bioluminescence images of nude mice after CCT with MSC-TF show the same three mice from the MSC-TF-no-MI and MSC-TF MI groups on days 2 and 8. The imaging parameters were as follows: medium binning; field of view, 12 cm; f-stop, 1; and time, 1 minute. Optical imaging of transplanted MSC in a small-animal model of MI. (d) Bar graph shows differences in cell growth kinetics between the mock-injection group (n = 3), the group with MSC but no reporter (n = 3), the group with MSC-TF but no MI (n = 5), and the group with MSC-TF and MI (n = 8) for images of nude mice after CCT with MSC-TF. Maximum (Max) radiance (in photons per second per square centimeter per steridian) was calculated for each region of interest, was averaged between mice of the same group, and was plotted as the mean ± standard deviation. Analysis with a mixed regression model showed significantly lower signal on days 8 and 14 than on day 2 (P = .011 and P = .001, respectively). The group with MSC-TF and MI showed significantly higher signal than the group without MI at days 4, 8, and 14 (P = .016). (e) Scatterplot shows correlation of normalized luciferase activity (in relative light units [RLU] per minute per microgram [of total heart protein]) of ex vivo heart lysates versus maximum radiance (in photons per second per square centimeter per steridian) for 13 mice at days 4, 8, and 12. Data were pooled from the MSC-TF-with-no-MI (n = 6) and MSC-TF-with-MI (n = 8) conditions. Luciferase activity versus maximum radiance was correlated (correlation coefficient = 0.832, P = .0004). (f) Bar graph shows normalized luciferase activity (in relative light units [RLU] per minute per microgram [of total heart protein]) of heart lysates after transplantation of MSC-TF, with and without MI, on days 8 and 14. Conditions were MSC-TF with no MI on day 8 (n = 2) and day 14 (n = 2) compared with MSC-TF with MI on day 8 (n = 2) and day 14 (n = 3). Data are plotted as means ± standard errors of the mean. (g) Bioluminescence images show activity in rats at days 1, 4, and 7 after 5 × 10⁶ MSC-TF for CCT after MI.

