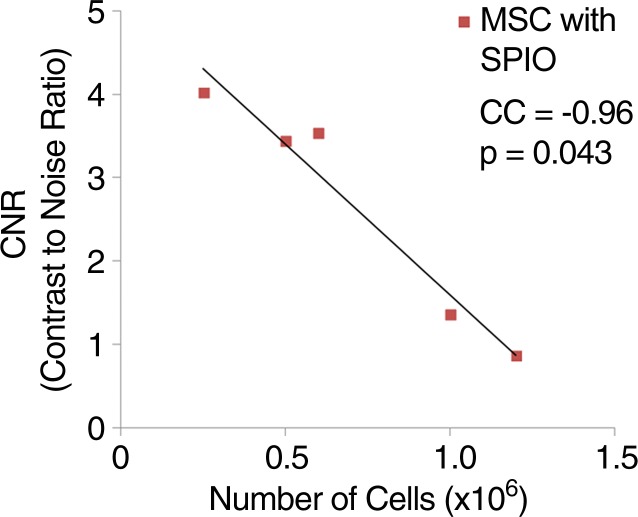
Figure 2c:
In vitro SPIO labeling of MSC-TF. (a) Image from transmission electron microscopy of SPIO NP. NP are 35 nm in diameter. Bar = 100 nm. (Image courtesy of Y. Andrew Yang, PhD, Ocean Nanotech, Springdale, Ark). (b) MR image of MSC-TF loaded with SPIO NP (30 µg/mL). MSC-TF were transferred into 96-well tubes at varying cell numbers. MR imaging was performed with GRE sequence (100/12, 30° flip angle, 12 × 12-cm field of view, 1-mm-thick sections, and 256 × 256 matrix). (c) Plot (from b) of CNR versus number of cells after in vitro MR imaging shows significant correlation ( R2 = 0.92, P = .0043). CNR was calculated as follows: signal-to-background ratio/noise. CC = correlation coefficient.

