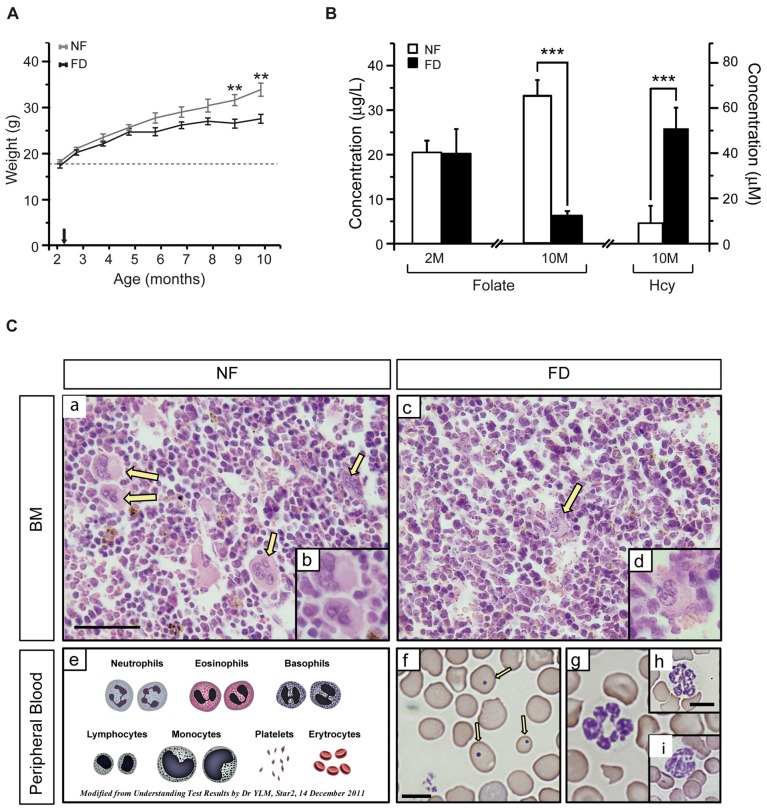
Figure 1.
(A) Weight gain along the study. The size of each group is specified in Table 2. Several mice from the folate-deficient (FD) group were sacrificed due to their condition, and hence the group size was reduced (n = 5) from 7 months of age onward. (B) Serum folate concentrations were measured at 2-months of age (2M) in the normal folate (NF; n = 9) and FD (n = 5) groups. At 10-months (10M) of age serum folate and homocysteine (Hcy) concentrations were determined in the NF (n = 9) and FD groups (n = 5). (C) Hematoxylin-eosin staining of bone marrow (a–d) and Wright staining of peripheral blood (f–i) at 10M (n = 5 for both dietary groups). Megakaryocytes (yellow arrows), scheme of normal erythrocytes and white series (e), anisocytosis and Howell-Jolly bodies (f, arrows). Bar scale 50 μm (a,c); 25 μm (b,d); 10 μm (remaining panels). Statistical analysis was performed between NF and FD groups at each of the specified time points; no evaluation within the same dietary groups was performed. **p < 0.01; ***p < 0.001.

