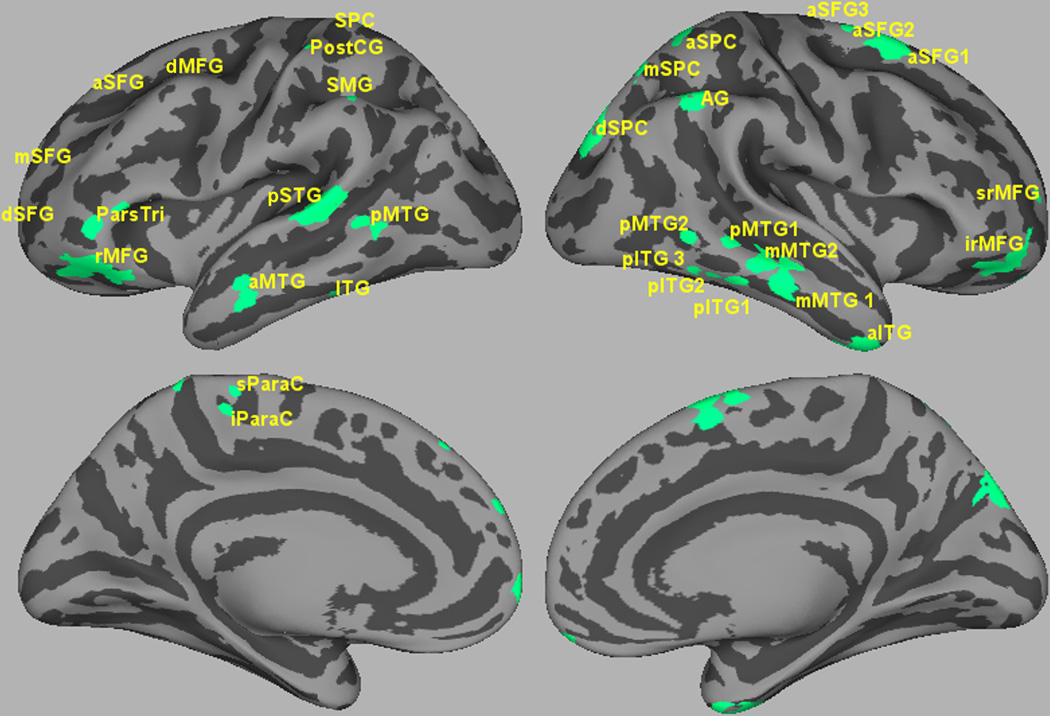
Figure 3.
A comparison of top-down influences on left pSTG activation (shown in red) after the onset (100–500 ms) of experimental versus baseline target-bearing words. The size of circles over ROIs reflects the difference in strength of Granger causation (number of time points that show GCi values with p < 0.05). Green circles indicate stronger influence in the experimental condition. Orange indicates stronger influence in the control condition. All differences shown have p < 0.05.

