
Fig. 1. Tracking cells and gene expression with bioluminescence imaging.
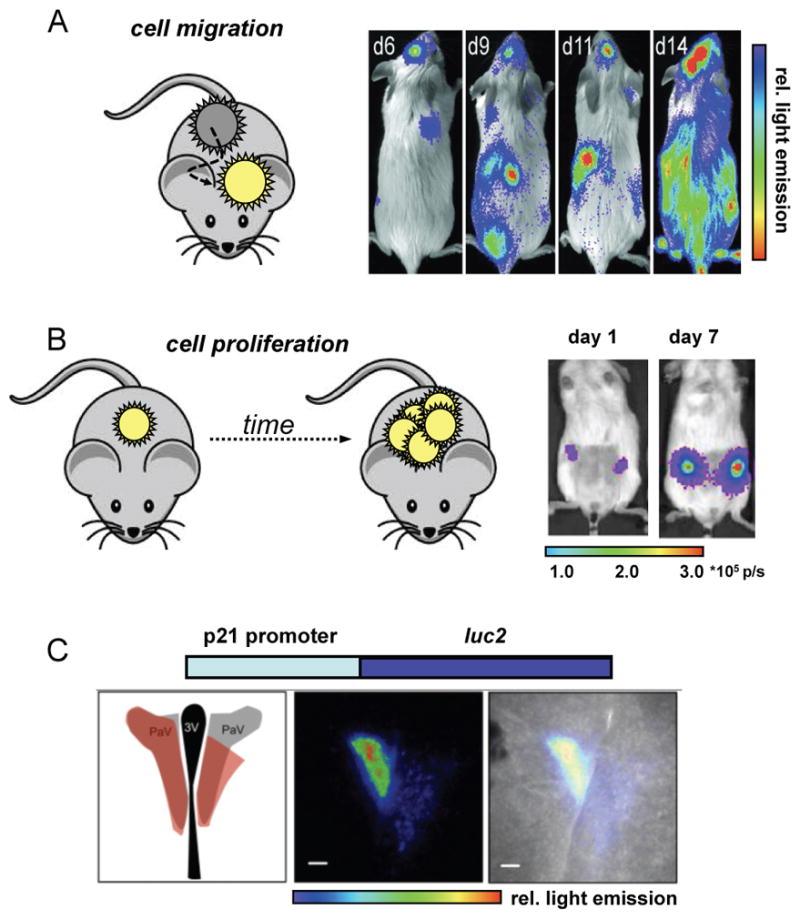
(A) Example of monitoring cell migration. Luciferase-labelled haematopoietic stem cells (HSCs) were transplanted into irradiated mice. Bioluminescence imaging with D-luciferin revealed multiple foci (sites of engraftment) at early time points. HSC differentiation and proliferation resulted in full regeneration of the blood system in these mice (as evident by the increase in spread and intensity of bioluminescent signal). Reprinted with permission from ref. 47. Copyright (2004) National Academy of Sciences, U.S.A. (B) Example of visualizing cell proliferation. Primary human cancer stem cells were transfected with luciferase genes and implanted into mouse mammary fat pads. Bioluminescence imaging revealed cell proliferation several weeks before palpable tumours emerged. Reprinted with permission from ref. 48. Copyright (2010) National Academy of Sciences, U. S. A. (C) To visualize gene expression, a luciferase gene (e.g., luc2) can be fused to the promoter for a gene of interest (e.g., p21). Cellular transcription of the target gene results in luciferase production. Luciferase was inserted downstream of an endogenous p21 promoter in transgenic mice, and regions of the mouse brain were probed for p21 activity using bioluminescence. From left to right: schematic of the mouse brain highlighting the paraventricular nucleus (PVN), the site of expected bioluminescence (red); bioluminescent image of brain tissue; overlay image showing localization of bioluminescent signal in the PVN. This research was originally published in ref. 61. Copyright (2013) the American Society for Biochemistry and Molecular Biology.