
Figure 4.
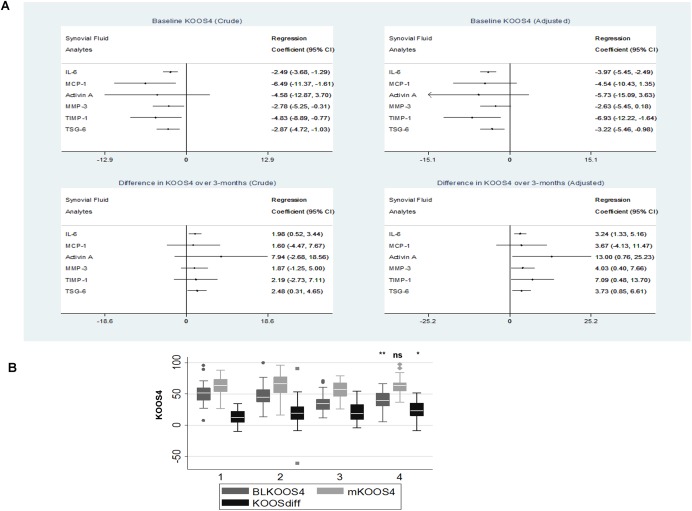
Association of SF analyte levels, including IL‐6 levels, with the clinical outcome KOOS4. A, Linear regression models of participants’ KOOS4 at baseline (top) and of the change in KOOS4 over 3 months (bottom) for each of 6 SF analytes at baseline. Forest plots of unadjusted (crude) results are shown on the left, and forest plots of results adjusted for 4 predefined variables (time from injury, injury category, presence of SF blood staining, and age) are shown on the right. 95% CI = 95% confidence interval. B, KOOS4 at baseline (BLKOOS4), KOOS4 at 3 months (mKOOS4), and change in KOOS4 over 3 months (KOOSdiff) for KICK participants grouped into quartiles of SF IL‐6 levels at baseline, with group 1 being the lowest quartile and group 4 being the highest quartile. Data are shown as box plots. Each box represents the 25th to 75th percentiles. Lines inside the boxes represent the median. Lines outside the boxes represent the 10th and 90th percentiles. Symbols indicate outliers. ∗ = P < 0.05; ∗∗ = P < 0.01 versus group 1 (lowest quartile of IL‐6 levels), by Mann‐Whitney U test. NS = not significant (see Figure 1 for other definitions). Color figure can be viewed in the online issue, which is available at http://onlinelibrary.wiley.com/journal/doi/10.1002/art.39677/abstract.