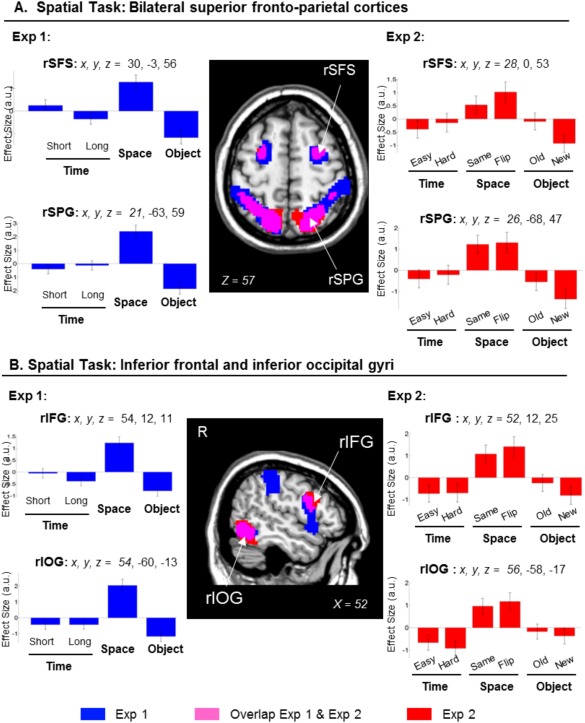
Figure 3.

Clusters of brain activation and signal plots for the Scene‐layout judgment (Spatial task). Clusters of activation and signal plots for (A) the superior frontal cortex and the superior parietal cortex bilaterally and (B) the right inferior occipital cortex and the right inferior frontal cortex. These regions activated for the Spatial task in Exp 1 (blue) and in Exp 2 (red; overlap between Exp 1 and Exp 2 in magenta). The activation selective for the Spatial task was computed with the contrast: S > [T(short+long)/2 + O]/2, inclusively masked with S > T(short+long)/2 and with S > O. The effects in the superior parietal gyri, the inferior occipital gyri and the right inferior frontal gyrus were replicated when considering only same/old images in Exp 2 (Table 1, rightmost columns). Activation clusters were estimated and displayed at P‐unc. = 0.001, thresholded at a minimum of 80 voxels. Effect sizes are mean adjusted (sum to zero) and are expressed in arbitrary units (a.u. ± 90% CI). L/R, left/right; SFS, superior frontal sulcus; SPG, superior parietal gyrus; IFG, inferior frontal gyrus; IOG, inferior occipital gyrus.
