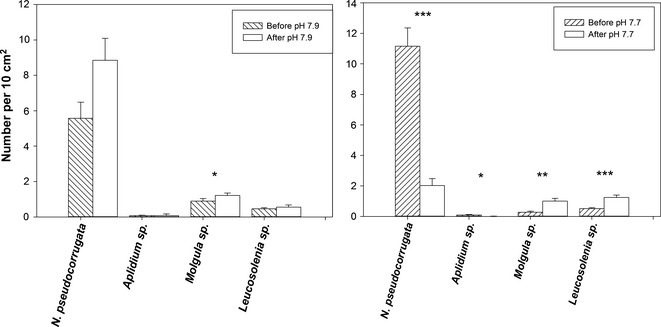
Figure 1.

Numbers of the main components of the biofouling community on precolonized HDPE pipe before and after exposure to either pH 7.9 (control) of pH 7.7 (predicted year 2100 level). Values are mean per 10 cm2 ± SE; significant differences shown in figure as: *P < 0.01, **P < 0.001, ***P < 0.0001.
