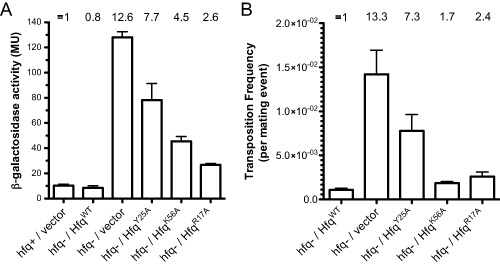
Figure 2.

Impact of mutant forms of Hfq on IS 10 transposase expression and transposition.
A. Transposase expression was measured in the context of a chromosomal transposase‐lac Z translational fusion (parent strain DBH298) with the indicated forms of Hfq expressed or in the absence of Hfq expression. The bars show β‐galactosidase activity (Miller units) with standard error of the mean, measured in mid‐exponential phase in LB (n = 8). Where indicated, the hfq− strain (DBH299) was transformed with a low‐copy plasmid encoding Hfq from its native promoter (P3). The mean relative expression observed for each strain is indicated at the top of the graph, where transposase‐lac Z expression in hfq+ was set at 1.
B. Transposition of chromosomal IS 10 HH104‐kan was measured by the conjugal mating out assay (see Experimental procedures) in an hfq− strain (DBH337) transformed with one of the indicated Hfq‐encoding plasmids. The mean relative transposition frequency for each strain is indicated at the top of the graph, where transposition in the presence of HfqWT was set at 1. Error bars indicate the standard error of the mean for two independent experiments (n = 8).
