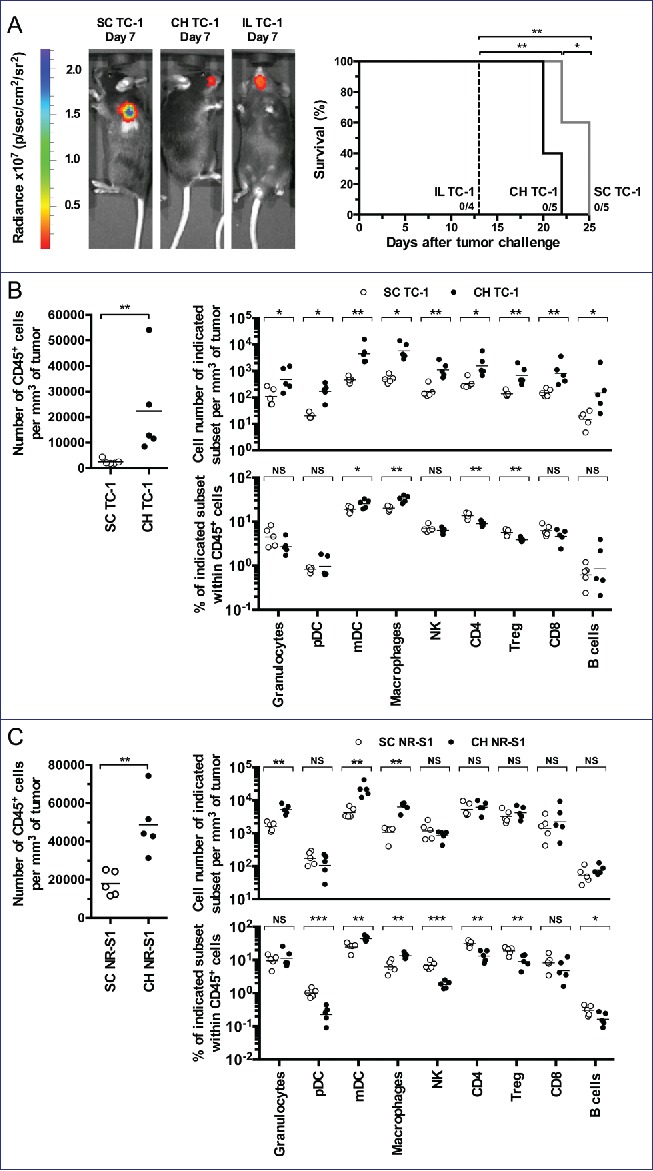
Figure 2.

Orthotopic tumor models for OSCCs. C57BL/6 mice (5 mice per group) were injected with TC-1-Luc cells using subcutaneous (SC), intra-cheek (CH) or intra-lingual (IL) routes. (A) A representative bioluminescence imaging is shown one-week after TC-1-Luc injection (left panel). Kaplan–Meier curves show tumor-specific survival rates (right panel). (B) Flow cytometry analysis of cell suspensions from tumors obtained two weeks after TC-1-Luc cell injection in C57BL/6 mice (5 mice per group). For gating strategy, see Fig. S1. Number of CD45+ cells per mm3 of tumor (left panel), cell number of indicated subset per mm3 of tumor (upper right panel) and percent of indicated subset within CD45+ cells (lower right panel) are presented. (C) Flow cytometry analysis of cell suspensions from tumors obtained two weeks after injection of NR-S1 cells using SC and IC routes in C3H mice (5 mice per group). Number of CD45+ cells per mm3 of tumor (left panel), cell number of indicated subset per mm3 of tumor (upper right panel) and percent of indicated subset within CD45+ cells (lower right panel) are showed. NS, non-statistical difference = p > 0.05; *p < 0.05; **p < 0.01; ***p < 0.001; ****p < 0.0001.
