
Figure 1.
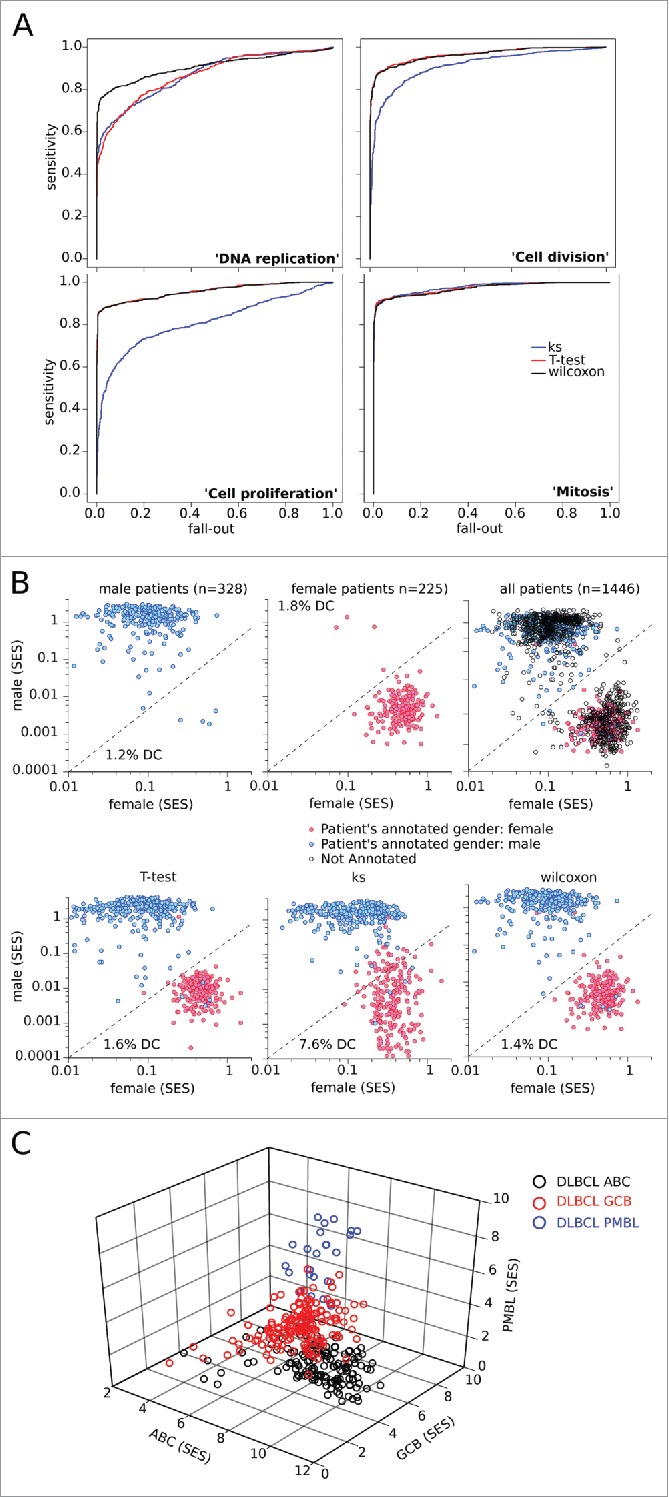
Quality control of the sample scoring test. (A) Performance of scoring methods by the Kolmogorov–Smirnov (KS), T-test, and Wilcoxon tests, compared by ROC curves for the gene sets “DNA replication”, “cell division”, “cell proliferation”, and “mitosis” in the cohort of (n = 1446) B-NHL transcriptomes split according to their proliferating or non-proliferating status (determined by phenotypic analysis). (B) Dot plots of sample enrichment scores (SES) for “female” versus “male” gene sets in the (n = 553) gender-annotated samples within the dataset, using the Wilcoxon test (top), or KS-, T-test-, or Wilcoxon-based scoring (bottom). The rate of discordant cases (DC) for molecularly-inferred versus clinically-annotated gender is indicated. (C) 3D plot of the (n = 553) subtype-specified DLBCL samples using Wilcoxon-based scores for the “ABC”, “GCB”, and “PMBL” gene sets (see Fig. S2).