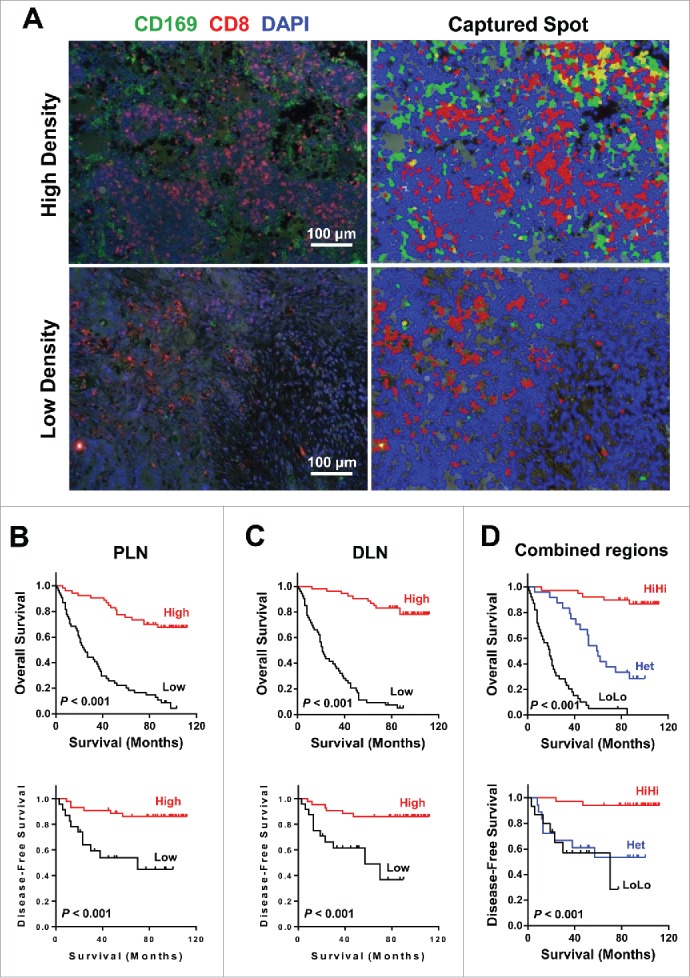
Figure 4.

Prognostic significance of CD169+CD8+ T cells in CRC patients. (A) (Left) A representative example of CD169 and CD8+ immunofluorescence staining of a tumor-draining LN section from CRC patients. CD8+ T cells (red), CD169 cells (green), and nuclei (blue) are shown. (Right) Digital image analyzed with the Nuance image software. (B–D) Cumulative OS and DFS times were calculated by the Kaplan–Meier method and analyzed by the log-rank test. The patients were divided into two groups according to the median value of CD169+CD8+ T cells in peri-LN (B), distant-LN (C), and combined regions (D).
