
Figure 2.
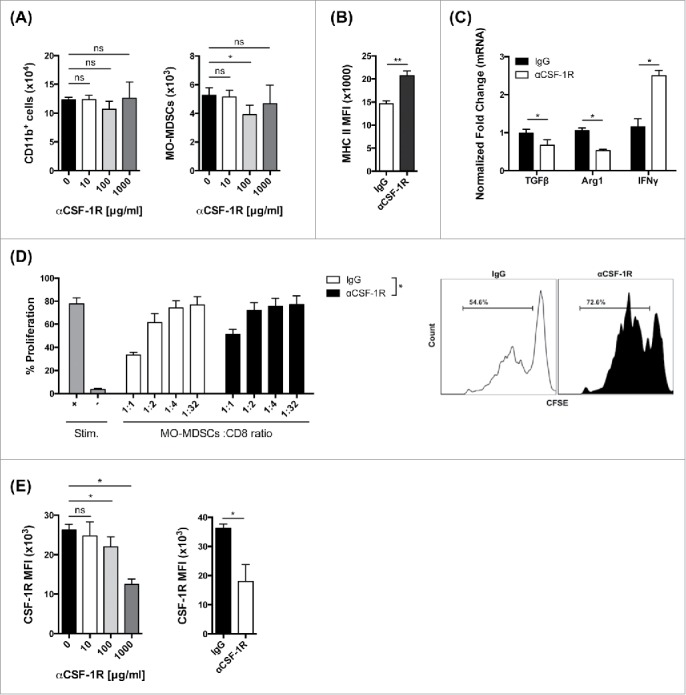
CSF-1/CSF-1R signaling blockade reprograms MO-MDSC response (A) Number of total CD11b+ cells and MO-MDSCs after in vitro culture of 4T1 tumor-infiltrating CD11b+ cells with different concentrations of αCSF-1R as indicated. (B) MHC class II expression by MFI in purified MO-MDSCs after in vitro culture with 100 μg/mL IgG or αCSF-1R. (C) RT-PCR analysis for Arg1, TGFβ and IFNγ mRNA expression on purified CD11b+ cells after in vitro culture with 100 μg/mL IgG or αCSF-1R. (D) CD8+ T cell suppression by MO-MDSCs from αCSF-1R-treated 4T1 tumor-bearing mice (day 23). Percent CD8+ T cell proliferation in different MO-MDSCs to CD8+ T cell ratios as indicated, and representative histograms of CD8+ T cell proliferation in MDSC to CD8+ T cell ratios of 1:2. (E) CSF-1R expression by MFI in purified MO-MDSCs after in vitro or in vivo treatment with IgG or αCSF-1R. Data are mean +/– SEM.