Figure 1.
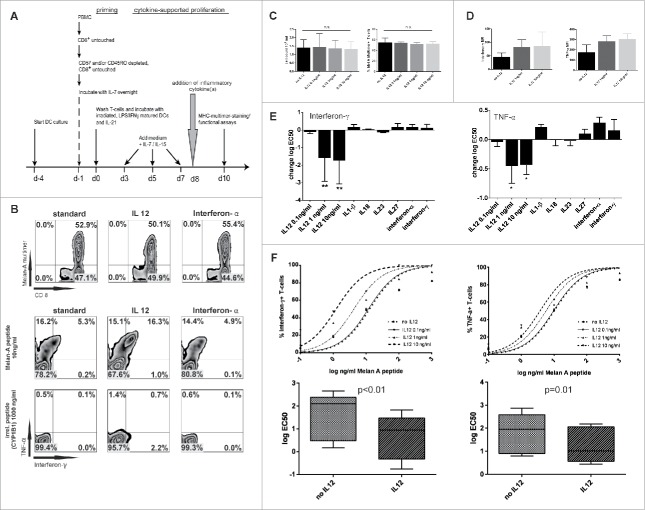
IL12 increases TCR sensitivity toward cognate antigen. (A) Experimental setting. After priming of Melan-A(26–35(27L)) specific T cells various cytokines were added after pooling of wells on day +8. IL7 and IL15 was present throughout the assay to ensure survival. 48 h later cells were evaluated for overall count, the percentage of Melan-A-multimer+ CD8+ T-cells and cytokine production upon restimulation. (B) Upper row: Representative dot plots of MHC-multimer-staining with no addition of inflammatory cytokines (standard, left), the addition of 10 ng/mL IL12 (middle) and interferon-α 450 IU/mL (right). Middle row: Staining of intracellular cytokines of CD8+ T cells stimulated with Melan-A(26–35(27L)) peptide (10 ng/mL; 2nd row) or bottom row: irrelevant peptide CYP1B1(239–247) (103 ng/mL; 3rd row), gated on CD8+. (C) Absolute cell counts (left) and percentages of multimer+ T-cells (right) on d + 10 of un- or IL12 treated cells in indicated dosages (Mean and SD, results from more than five experiments). (D) MFI values on d + 11 of interferon-γ and TNF-α in untreated or IL12 treated T cells stimulated with Melan-A(26–35(27L)) peptide loaded on autologous monocytes (103 ng/mL). Results are from five independent experiments. MFI of irrelevant peptide-pulsed monocytes is subtracted. (E) Log EC50 of interferon-γ and TNF-α was calculated from the response curves for each indicated cytokine. Indicated is the difference to “standard” (= no additional inflammatory cytokine, only IL7/IL15) treatment. Results are from five independent experiments, each cytokine was tested at least three times. *p < 0.05; **p < 0.01.(F) Upper panel: representative response curves of interferon-γ and TNF-α, gated on CD8+ T cells. The percentage of cytokine+ T cells is put in relation to the respective percentage of MHC-multimer+CD8+ T cells in each sample. Lower panel: Changes in logEC50 from five independent experiments of interferon-γ and TNF-α no IL12 vs. IL12 (10 ng/mL) normalized for CD8+multimer+ T cells. Log EC50 of interferon-γ and TNF-α was calculated from the response curves for each indicated cytokine. Indicated is the difference to “standard” (= no additional cytokine) treatment.

